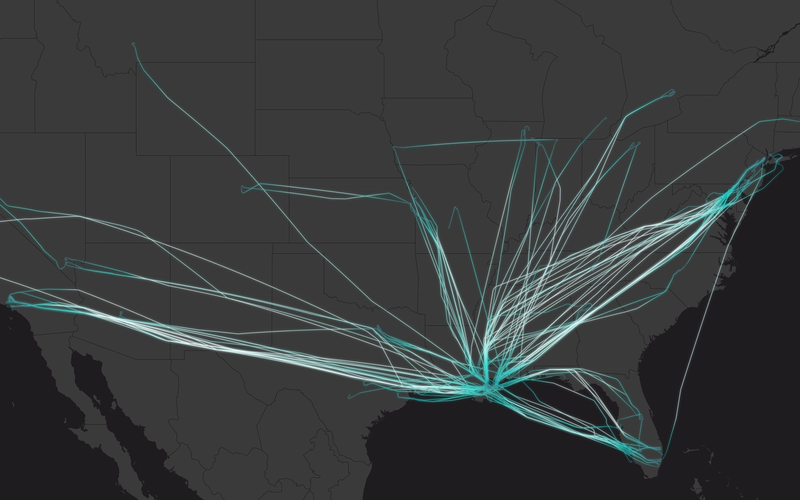
![Flight Density Map - January 25, 2026, 12:00-04:00 UTC]](https://cdn.sanity.io/images/tktrs3g8/production/b4c0e1f314f298bc8875b3b9dbf1ea81fb2b3dda-7560x3240.png?rect=0,1,7560,3238&w=2400&h=1028)
Numbers tell you 11,000 flights were canceled on Sunday. But when you actually map the flight density across the United States during Winter Storm Fern, you see something more profound—you watch the eastern states aviation network collapse in real time.
We've analyzed ADS-B tracking data from January 23-25, filtering for aircraft commonly used in airline operations during the critical 16-hour window from 12:00 UTC to 04:00 UTC the following day. The resulting visualizations reveal patterns that cancellation statistics simply can't capture.
The Storm
Winter Storm Fern stretched 2,000 miles from the Mexico border into Canada. For aviation, January 25 became the worst day for weather-related cancellations since the early COVID-19 pandemic—over 11,000 flights scrubbed, marking the highest single-day total since March 30, 2020. American Airlines called it the most disruptive storm in the carrier's 100-year history, canceling over 9,000 flights across the weekend.
The storm generated over 700 ice damage reports from Texas to the Carolinas. Nashville set a precipitation record on January 24 with 1.92 inches, much of it freezing rain. The Northeast saw heavy snow: Boston received 16.7 inches, Baltimore 11.3 inches, Philadelphia 9.3 inches. Over 1,000 flights were canceled at Atlanta's Hartsfield-Jackson alone.
But here's what the cancellation numbers don't show you: where the aircraft actually were, how the network density changed when the storm hit.
Thursday, January 23: Normal Operations
Thursday was normal. Our data captured 96,938 flight legs operated by 38,856 unique aircraft. Aircraft flew 31.0 million nautical miles and logged 125,383 flight hours. Average flight leg: 320 nautical miles, lasting 77.6 minutes—typical metrics for the mix of regional, domestic, and long-haul operations that keep the system moving.
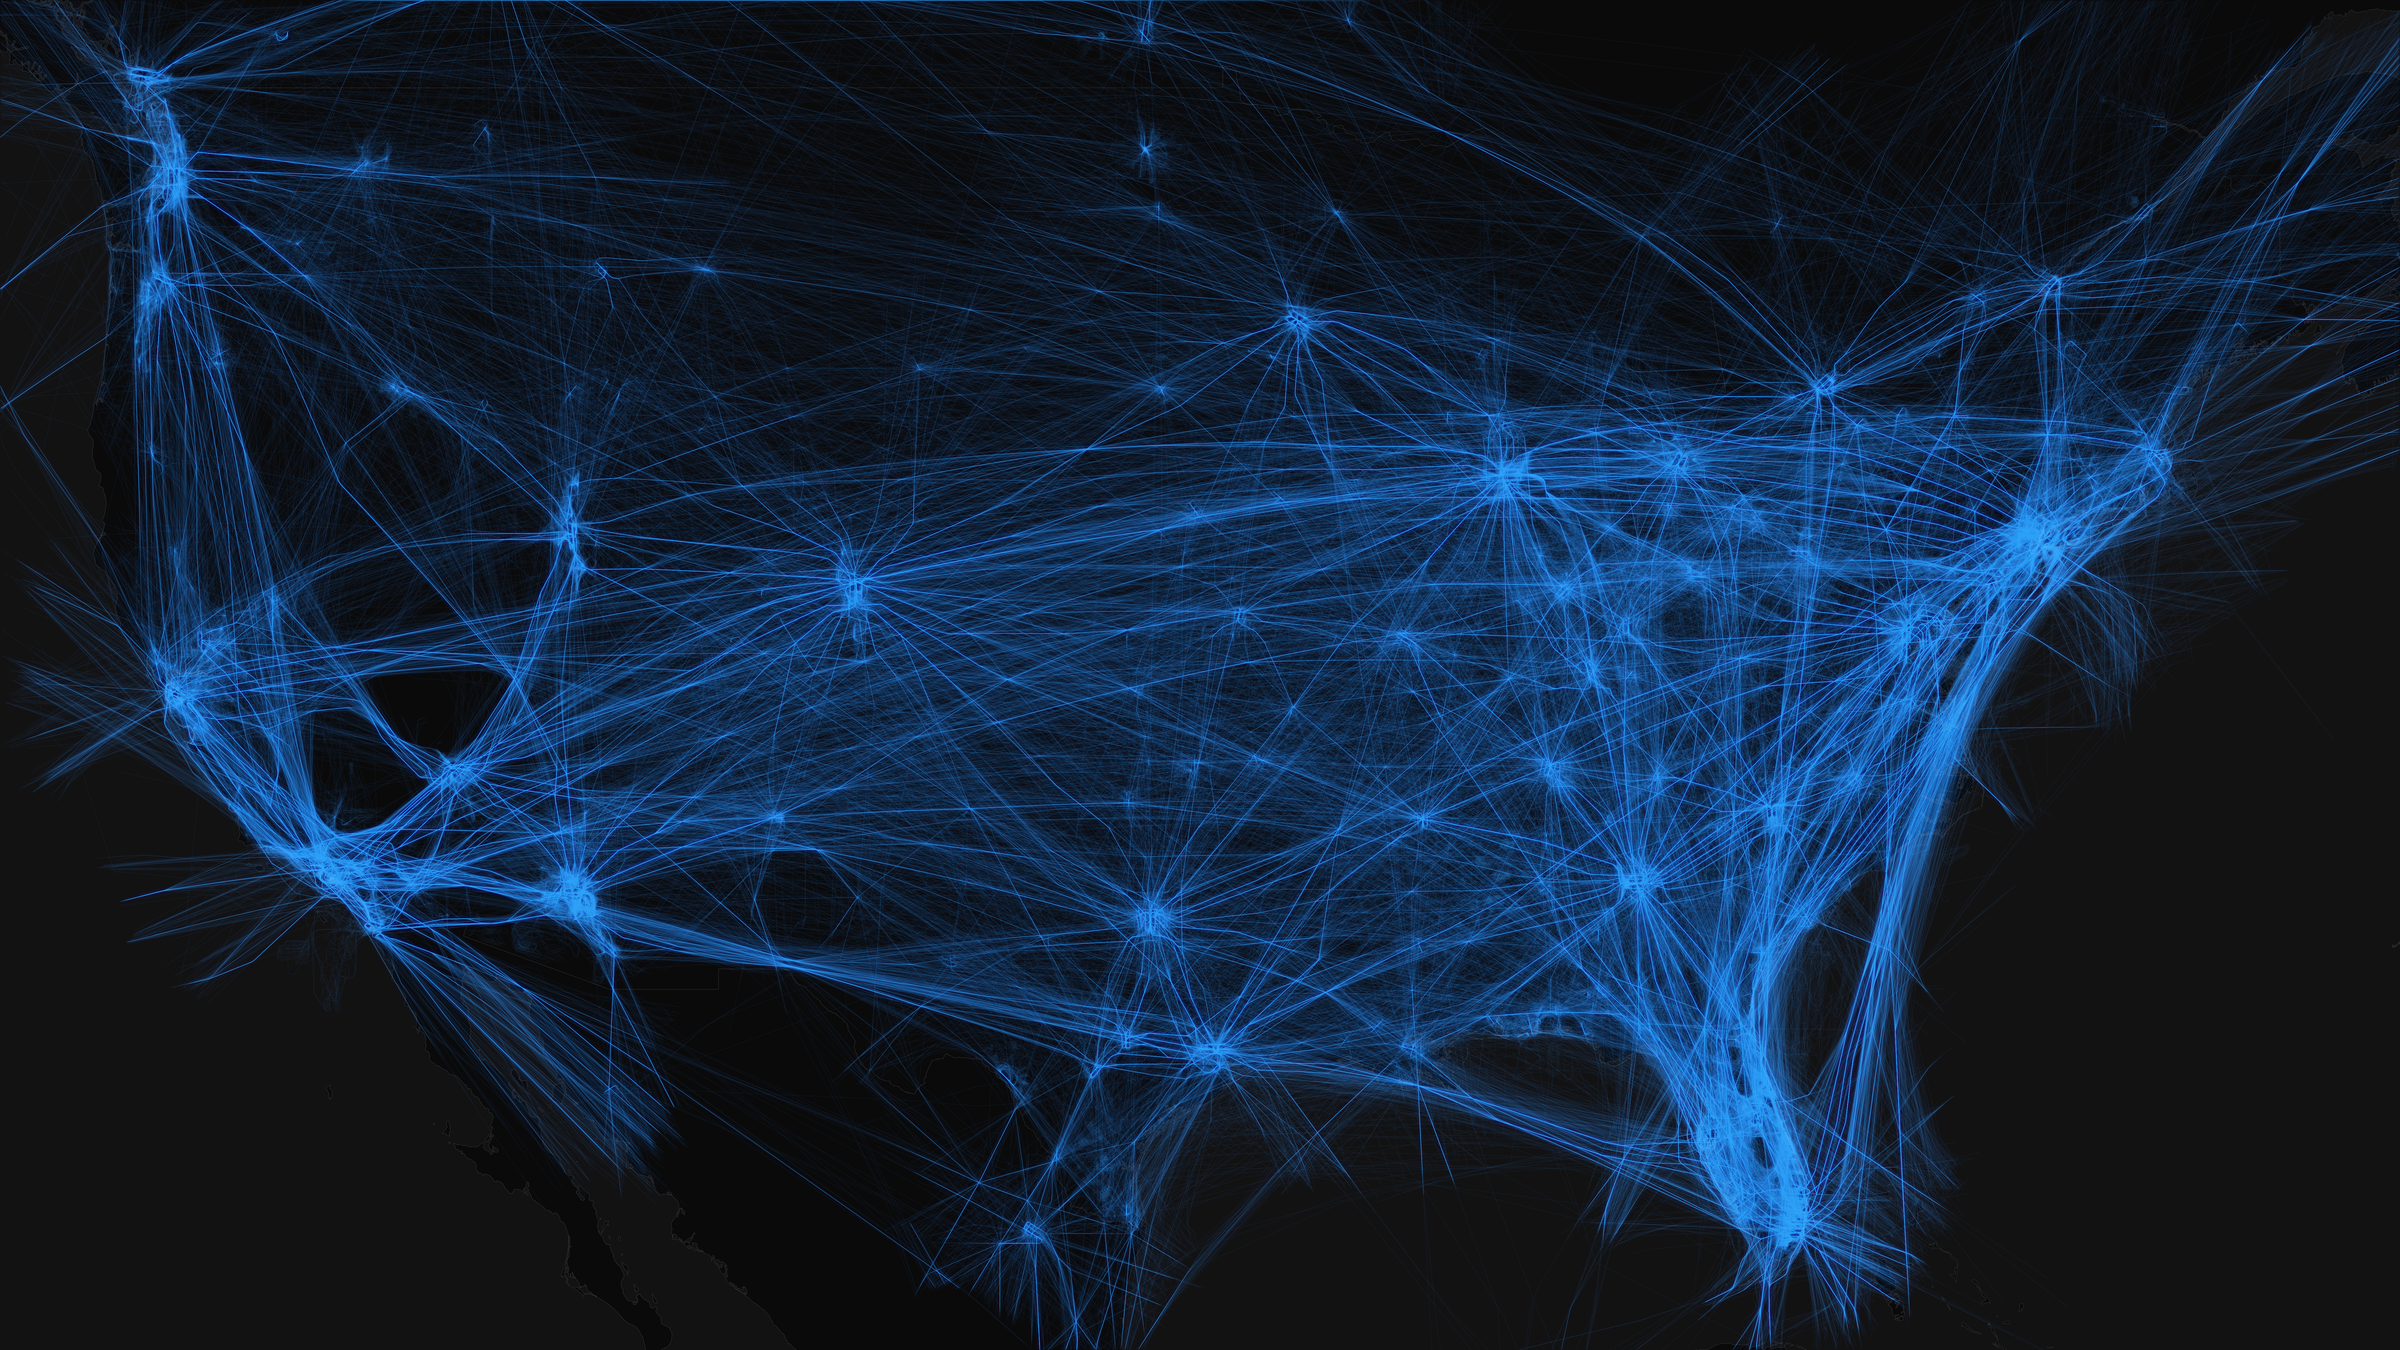
The visualization shows the aviation network at full capacity: dense activity patterns around Atlanta, Dallas-Fort Worth, and Chicago, transcontinental routes connecting the coasts, and that familiar spider-web of connections that makes American aviation work.
Saturday, January 25: The Storm
By Saturday, the storm's impact on network density was unmistakable.
Flight operations dropped to 91,369 legs—down 5,569 from Thursday's baseline. Unique aircraft fell to 30,894, a 20.5% reduction from Thursday. Of the 38,856 aircraft operating Thursday, 19,253 didn't fly at all on Saturday—nearly half the fleet grounded. Meanwhile, 11,291 aircraft that didn't fly Thursday appeared on Saturday—aircraft pulled from maintenance to maximize available capacity where conditions permitted.
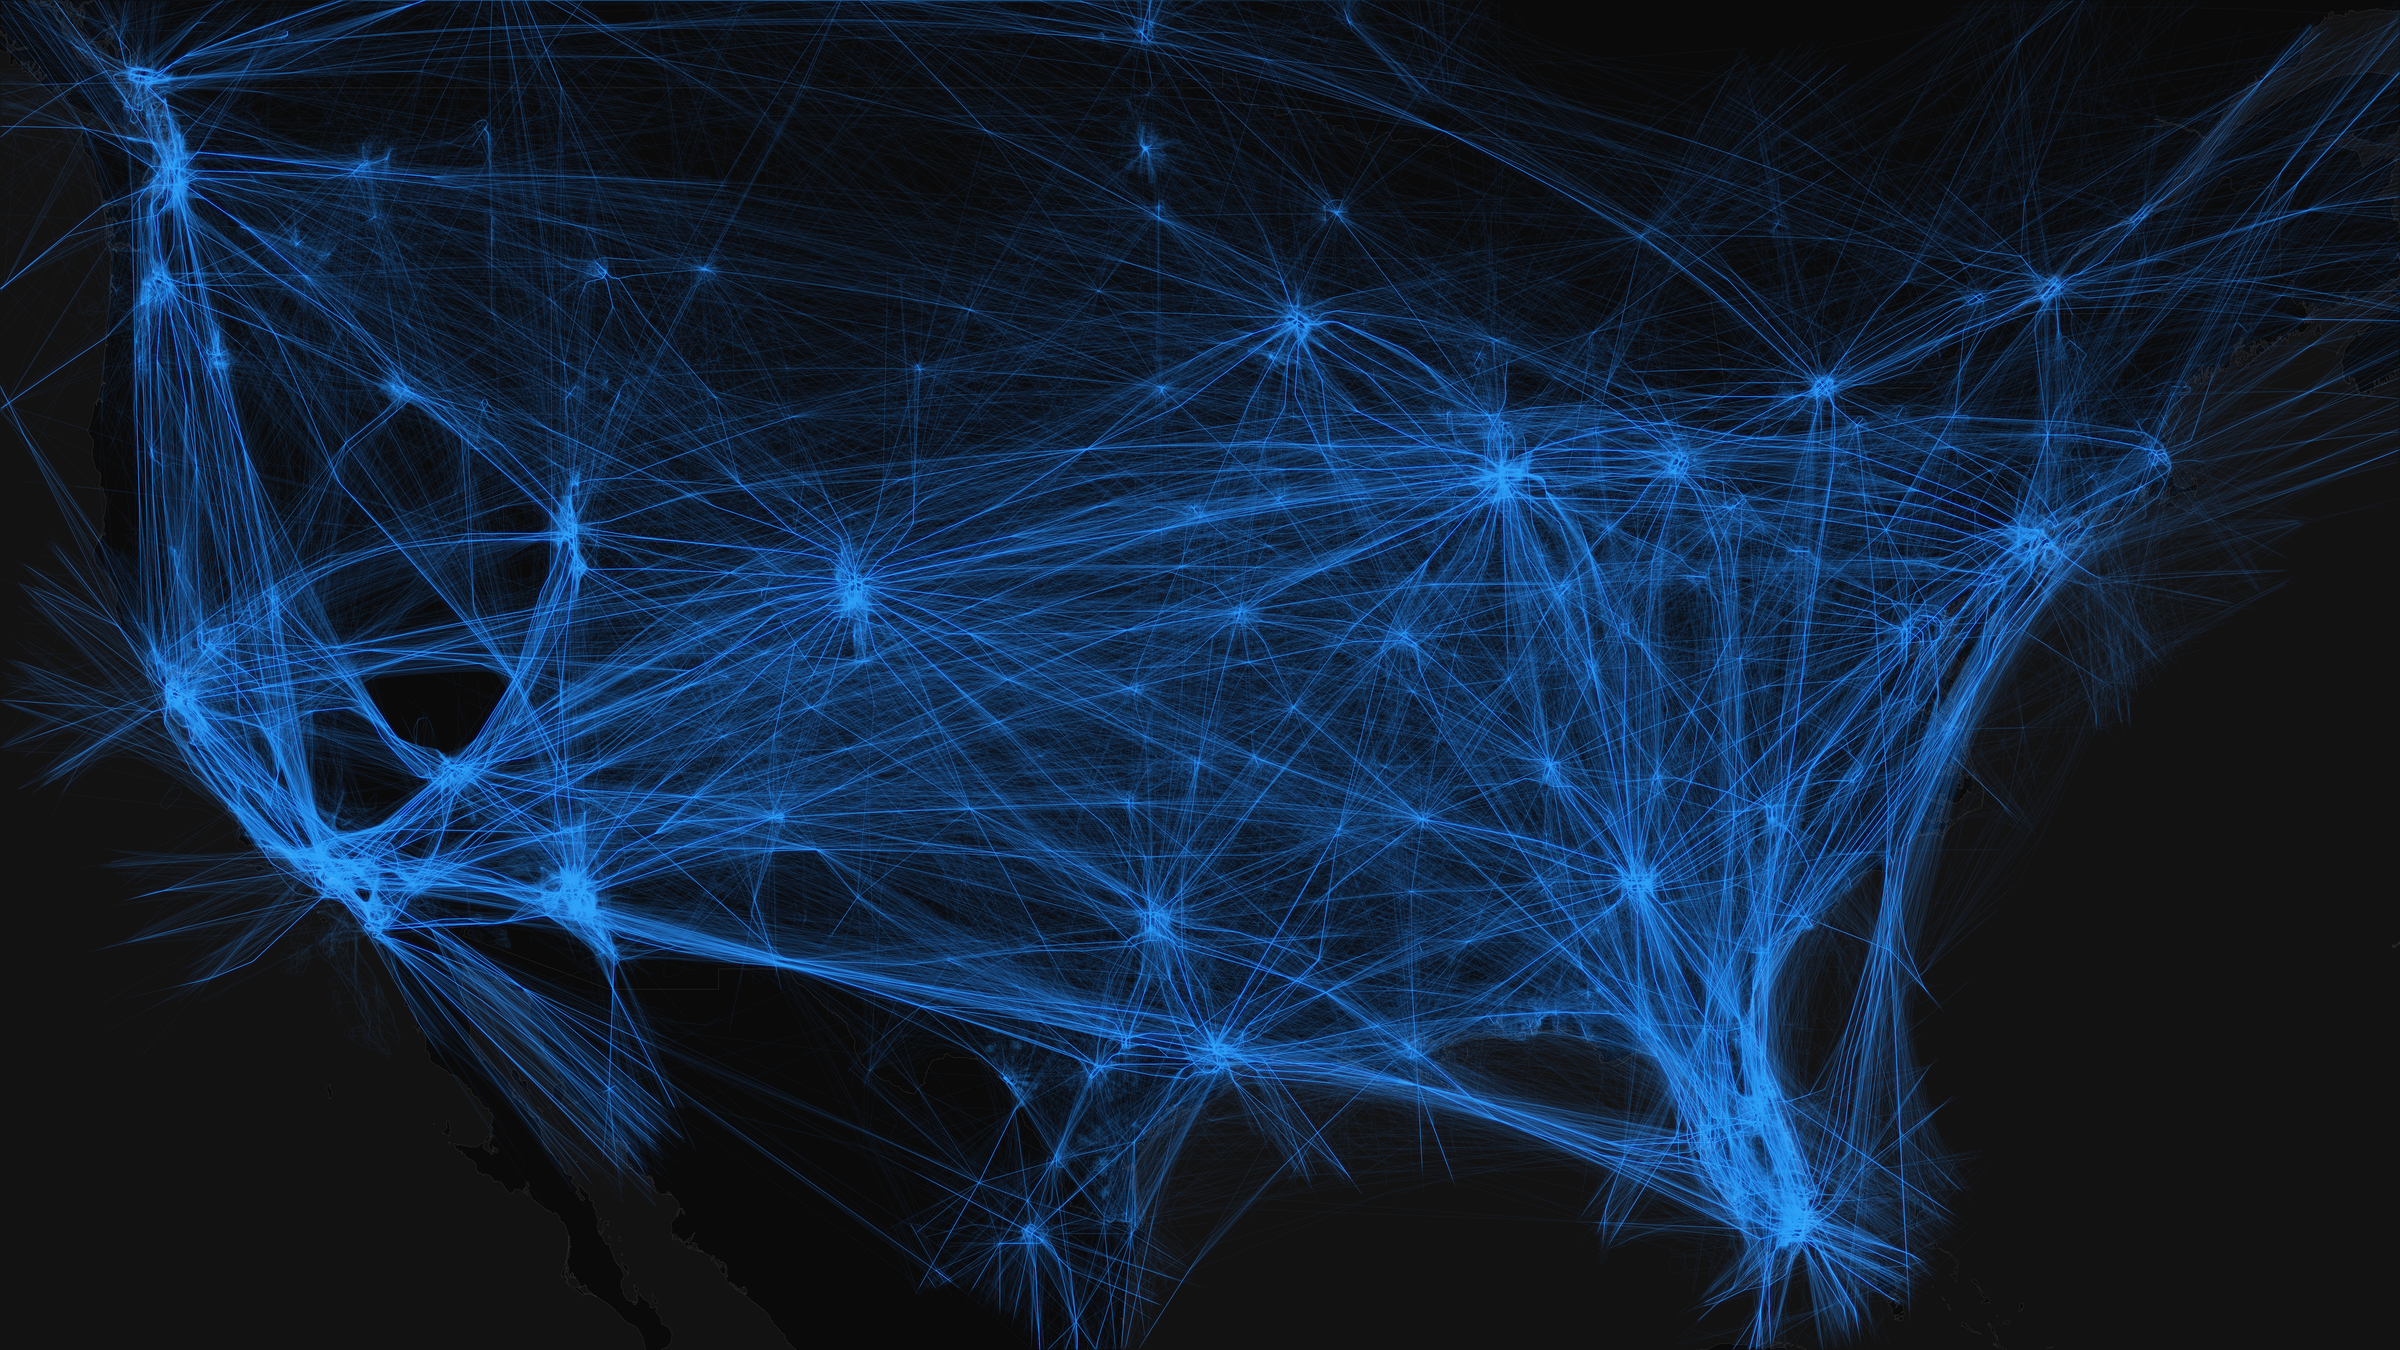
The visualization shows a measurably sparser network across affected regions. The Southern corridor from Texas through Tennessee and the Carolinas—where ice was falling—shows reduced activity. Major hubs that normally see constant operations display noticeable gaps in coverage.
Total distance flown: 31.7 million nautical miles. The system operated with significantly reduced capacity.
Major hubs saw massive cancellations. Over 1,000 flights were canceled at Atlanta's Hartsfield-Jackson International Airport. At LaGuardia, 90% of flights were scrubbed. Reagan National in DC canceled all flights.
What the Maps Show
Placing the visualizations side-by-side reveals the storm's impact at a glance. Thursday's map shows the familiar dense web of commercial aviation: heavy concentrations around major hubs, transcontinental routes crisscrossing the country, constant activity along the coasts. Saturday's map tells a different story—noticeable gaps where flights should be, reduced density across the entire eastern network, and particularly sparse activity in the storm's direct path.


The comparison highlights three distinct regional patterns:
The Southern Ice Zone: The most dramatic change appears from Texas through the Tennessee Valley. Thursday shows robust activity through this corridor. Saturday shows significant gaps. Over 700 ice reports came from this region—airports without robust de-icing infrastructure saw operations severely constrained.
The Mid-Atlantic Snow Belt: Baltimore, Philadelphia, and Pittsburgh maintained some operations despite heavy snow (11.3", 9.3", and 11.2" respectively), but the visual density is noticeably reduced compared to Thursday.
The Northeast: Boston's 16.7 inches challenged even winter-prepared airports. The side-by-side comparison shows continued operations but at reduced capacity. LaGuardia closed completely while other Northeast airports maintained limited service.
The Ripple Effect: Perhaps most striking in the comparison—airports in clear weather show reduced density too. When Dallas and Atlanta shut down, the hub-and-spoke system cascades outward. Aircraft stuck in the wrong cities. Crews unable to reposition. Connections broken across the entire network, visible in the visual comparison far beyond the storm's geographic footprint.
Methodology
This analysis uses ADS-B (Automatic Dependent Surveillance-Broadcast) data collected across the Lower 48 states and portions of Mexico and Canada during the 16-hour window from 12:00 UTC to 04:00 UTC the following day for each date—capturing peak operational hours across North American time zones.
Geographic scope: All three visualizations use consistent geographic bounds (latitude 23.03° to 50.46°, longitude -126.82° to -64.68°) covering the contiguous United States and adjacent portions of Mexico and Canada, enabling direct comparison of flight density patterns before and during the storm.
Critical note: We filtered exclusively for aircraft commonly used in airline operations—commercial jets and turboprops operated by passenger and cargo carriers. General aviation, private aircraft, and military operations were excluded to isolate the commercial aviation network's response.
Flight legs were segmented using proprietary algorithms analyzing position, altitude, and speed data. This approach differs from published FAA or FlightAware statistics—we're tracking actual aircraft movements, not scheduled operations.
Key metrics include total flight legs, unique aircraft (by ADS-B transponder codes), distance calculated from position data, flight duration from takeoff to landing events, and geographic extent of operations. The data reflects what actually flew, not what was supposed to fly.
Sources: Winter Storm Fern impact data from Wikipedia, National Weather Service, ABC News, CBS News, NBC News, NPR, Reuters, CNBC, FlightAware, and Cirium. Fatalities: at least 50 confirmed as of January 26, 2026 (Wikipedia), with other sources reporting varying totals as investigations continued. Flight cancellations: 11,000+ on January 25 (CBS News, Reuters, FlightAware, NPR, multiple sources), highest single-day total since March 30, 2020 during COVID-19 pandemic (Cirium data via ABC News); American Airlines: 9,000+ weekend cancellations, "most disruptive storm in airline's 100-year history" (ABC News, multiple sources confirming direct airline statement). Atlanta Hartsfield-Jackson: over 1,000 flights canceled (Wikipedia). Ice reports: 700+ from National Weather Service (Weather Channel/Yahoo). Power outages: over 1 million peak (Wikipedia, multiple sources). Snowfall totals: Boston 16.7" at Logan Airport (National Weather Service/WBUR), Baltimore 11.3", Philadelphia 9.3" (Philadelphia recorded 9.1" per Wikipedia, referenced as 9.3" in some sources), Pittsburgh 11.2" (Wikipedia). Nashville precipitation record: 1.92" on January 24, 2026 (Wikipedia). Toronto Pearson: 560+ flights canceled by 3:00 PM Friday (Wikipedia). Storm extent: 2,000 miles, 170 million people affected, 37 states (Wikipedia, multiple sources).
*Note: All flight statistics derived from proprietary ADS-B data analysis covering the Lower 48 states and portions of Mexico and Canada during specified time windows. Analysis includes only aircraft commonly used in airline operations (commercial jets and turboprops). Flight segmentation performed using algorithms that may produce counts differing from FAA or commercial flight tracking services.*