CPHEKCH
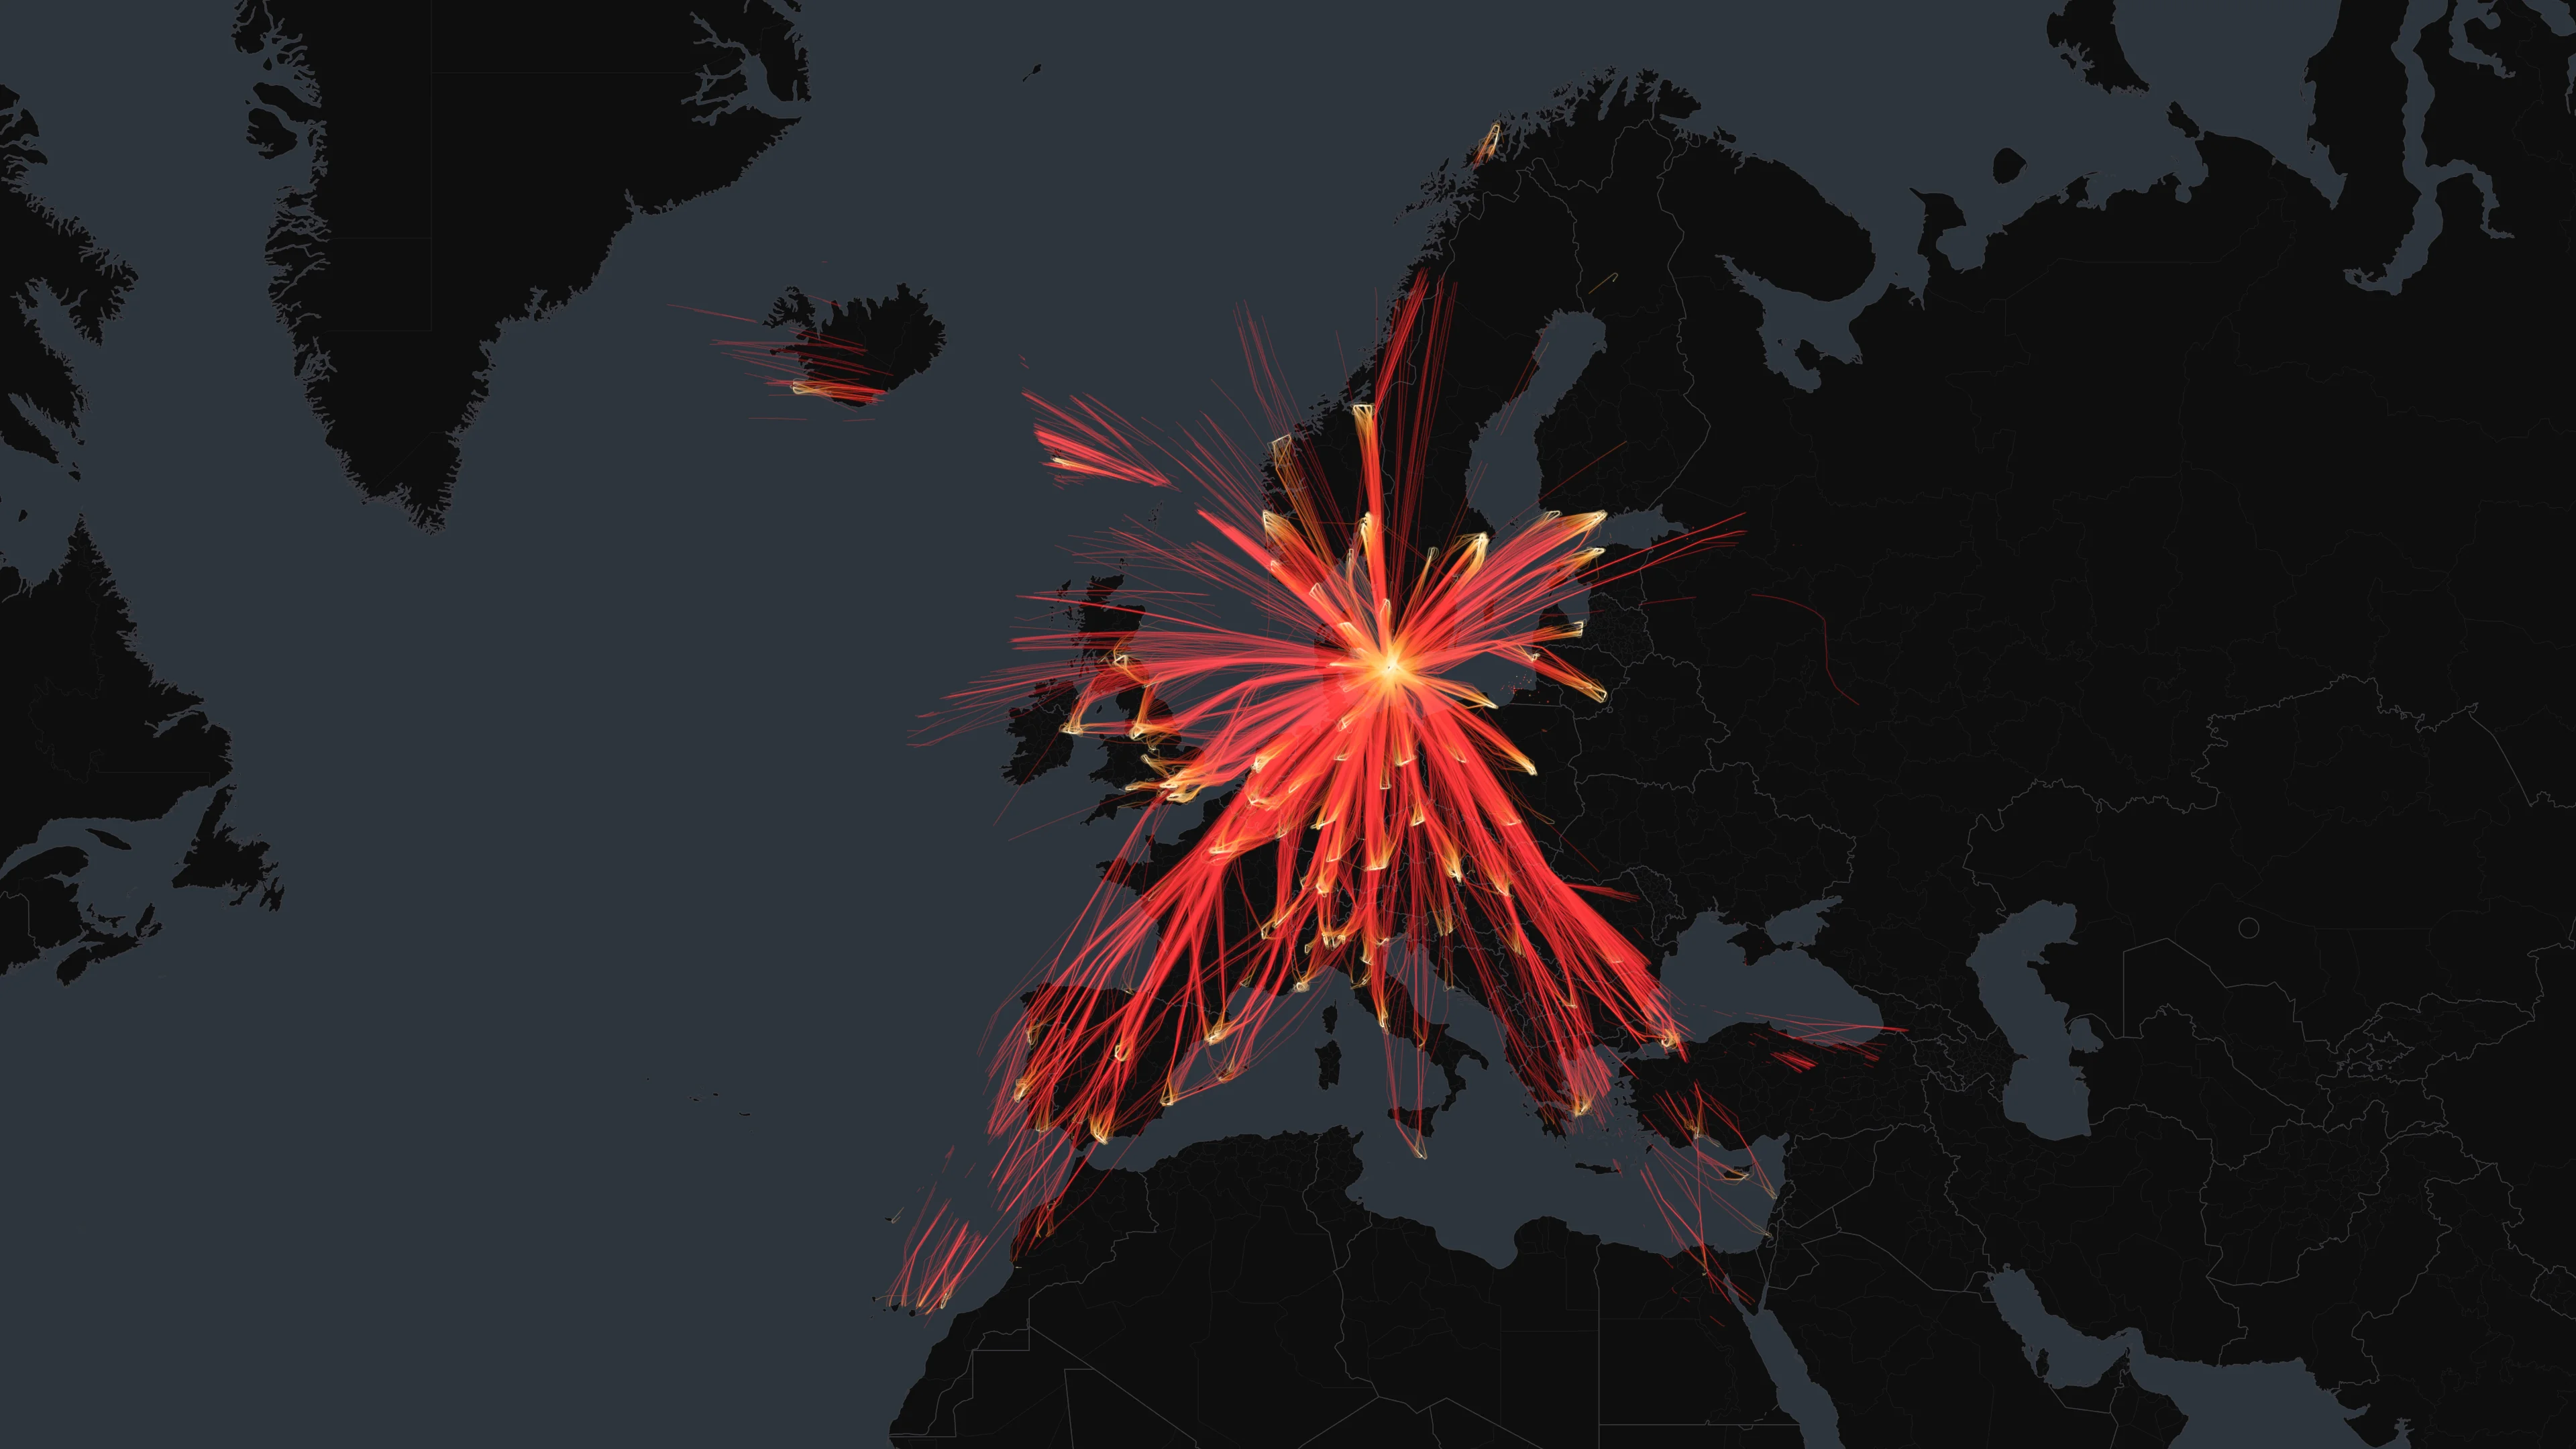
October 31, 2025 – November 19, 202520 days10,934 flights7,438,502 ADS-B points

Get this print
About the data
Flights reconstructed from ADS-B, the position signal modern aircraft broadcast to air traffic. Coverage is strongest across North America and Europe, thinner over oceans, polar regions, and parts of Asia and Africa.
The print is a curated selection. To draw the clearest image, I keep the flights with a clean arrival or departure at the airport and set the rest aside; on a busy airport, that can be most of the raw ADS-B. Every stat, route, and total on this page counts only those kept flights.
A few of those kept flights are long-haul, crossing sparsely-covered airspace where the receiver network loses sight of them mid-ocean. That leaves an origin or destination unknown, which I mark rather than guess. They still count in the totals above, but the route-by-route breakdown lists only flights with both endpoints identified.
About Copenhagen Kastrup Airport
The sky over Copenhagen Kastrup Airport
The arrivals and departures behind the print, colored by altitude.
Loading flights…
Summary
Total flights
10,934
Arrivals
5,111
Departures
5,823
Unique aircraft
1,603
Peak day flights
648
Avg / day
547
Notable flights
Shortest
42 NM12 min
To AGH — Ängelholm-Helsingborg
CS-CLA
Longest
5166 NM81 min
From TLL — Lennart Meri Tallinn
Highest
49,575 ft1202 NM
To ATH — Athens
Most seen aircraft
96flights
4CABDA
Day highlights
Each day in CET time
Busiest day
Oct 31, 2025
648 flights · 327 arr / 321 dep
Quietest day
Nov 15, 2025
389 flights · 137 arr / 252 dep
Avg daily flights
547
across 20 days
| Date | Flights |
|---|---|
| Fri 10/31 | 648 |
| Sat 11/1 | 507 |
| Sun 11/2 | 576 |
| Mon 11/3 | 634 |
| Tue 11/4 | 527 |
| Wed 11/5 | 542 |
| Thu 11/6 | 576 |
| Fri 11/7 | 550 |
| Sat 11/8 | 487 |
| Sun 11/9 | 581 |
| Mon 11/10 | 552 |
| Tue 11/11 | 531 |
| Wed 11/12 | 540 |
| Thu 11/13 | 588 |
| Fri 11/14 | 571 |
| Sat 11/15 | 389 |
| Sun 11/16 | 560 |
| Mon 11/17 | 553 |
| Tue 11/18 | 521 |
| Wed 11/19 | 501 |
Performance
Max altitude
49,575ft
Avg altitude
19,131ft
Max groundspeed
697kts
Avg groundspeed
317kts
Total distance
6,492,030NM
Avg leg distance
594NM
Avg leg duration
94min
Traffic flow
Arrivals
Departures
Flight trails
Routes
Arriving from
ARN
Stockholm-Arlanda Airport303
AMS
Amsterdam Airport Schiphol202
OSL
Oslo-Gardermoen International Airport189
LHR
London Heathrow Airport184
HEL
Helsinki Vantaa Airport154
CDG
Charles de Gaulle International Airport142
FRA
Frankfurt Airport121
ZRH
Zürich Airport118
VIE
Vienna International Airport115
MUC
Munich Airport108
BRU
Brussels Airport104
WAW
Warsaw Chopin Airport97
AAL
Aalborg Airport91
MAN
Manchester Airport81
BER
Berlin Brandenburg Willy Brandt Airport79
BGO
Bergen Airport, Flesland79
AGP
Málaga-Costa del Sol Airport77
GDN
Gdańsk Lech Wałęsa Airport76
LGW
London Gatwick Airport73
HAM
Hamburg Helmut Schmidt Airport73
Departing to
ARN
Stockholm-Arlanda Airport317
AMS
Amsterdam Airport Schiphol224
OSL
Oslo-Gardermoen International Airport214
LHR
London Heathrow Airport207
HEL
Helsinki Vantaa Airport167
CDG
Charles de Gaulle International Airport151
FRA
Frankfurt Airport134
ZRH
Zürich Airport134
VIE
Vienna International Airport128
MUC
Munich Airport116
BRU
Brussels Airport108
WAW
Warsaw Chopin Airport105
AAL
Aalborg Airport101
MAN
Manchester Airport91
BER
Berlin Brandenburg Willy Brandt Airport88
AGP
Málaga-Costa del Sol Airport88
BCN
Josep Tarradellas Barcelona-El Prat Airport84
GDN
Gdańsk Lech Wałęsa Airport83
LGW
London Gatwick Airport82
HAM
Hamburg Helmut Schmidt Airport81
Aircraft by registration country
Ireland149
Türkiye145
Germany135
United Kingdom131
Sweden124
Malta103
Austria85
France65
Poland61
Denmark53
Aircraft
1603 unique aircraft
4CABDAADS-B hex code — tail number not resolved
96 flights
4CACB5ADS-B hex code — tail number not resolved
93 flights
SE-MNP
90 flights
4CACB4ADS-B hex code — tail number not resolved
89 flights
4CACB6ADS-B hex code — tail number not resolved
88 flights
4CAD40ADS-B hex code — tail number not resolved
87 flights
4CAFD7ADS-B hex code — tail number not resolved
86 flights
4CAC9FADS-B hex code — tail number not resolved
85 flights
OY-KBO
84 flights
4CAC8AADS-B hex code — tail number not resolved
83 flights
4CACBDADS-B hex code — tail number not resolved
78 flights
SE-ROE
77 flights
4CAF14ADS-B hex code — tail number not resolved
77 flights
OY-LHB
76 flights
4CA660ADS-B hex code — tail number not resolved
75 flights
4CAF13ADS-B hex code — tail number not resolved
74 flights
4CAFCCADS-B hex code — tail number not resolved
74 flights
4CAFCDADS-B hex code — tail number not resolved
74 flights
4CAFD6ADS-B hex code — tail number not resolved
74 flights
4CAD96ADS-B hex code — tail number not resolved
73 flights
The shape above is CPH's portrait, on museum-quality aluminum.