Stories

Aviation Stories

Exploring famous flights, airline histories, and the art of flight visualization.

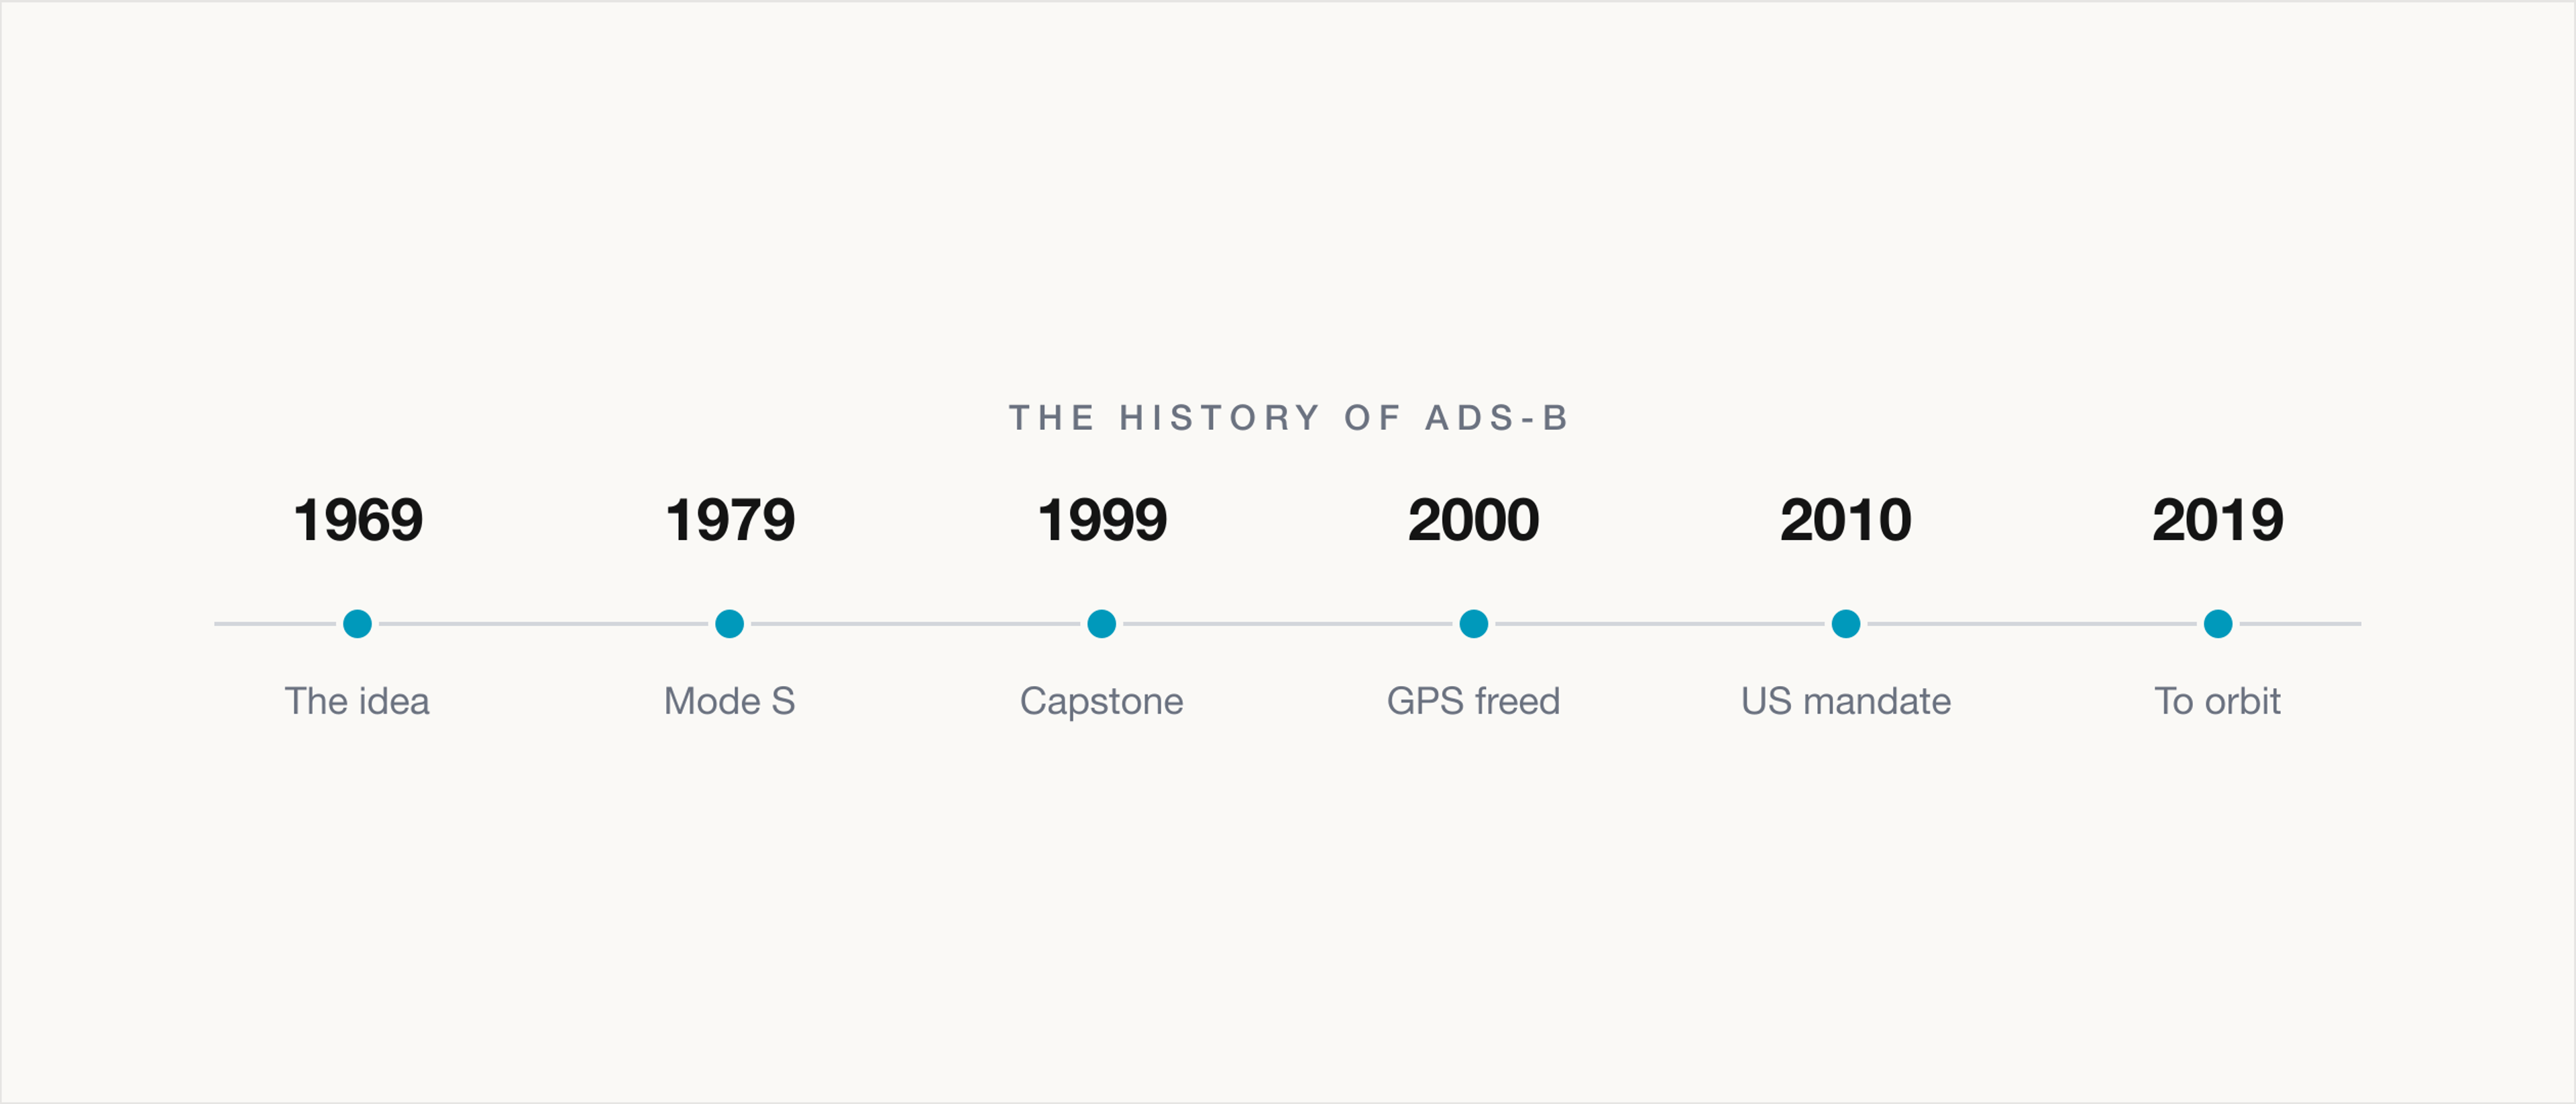
A horizontal timeline titled The History of ADS-B, marking six milestones from 1969 to 2019: the idea in 1969, Mode S in 1979, the Capstone program in 1999, GPS accuracy freed in 2000, the US mandate in 2010, and space-based ADS-B reaching orbit in 2019.

The History of ADS-B

ADS-B took fifty years to develop: an addressable transponder in the 1970s, GPS freed in 2000, an Alaska proving ground, a 2020 mandate, and surveillance from orbit.

July 8, 2026
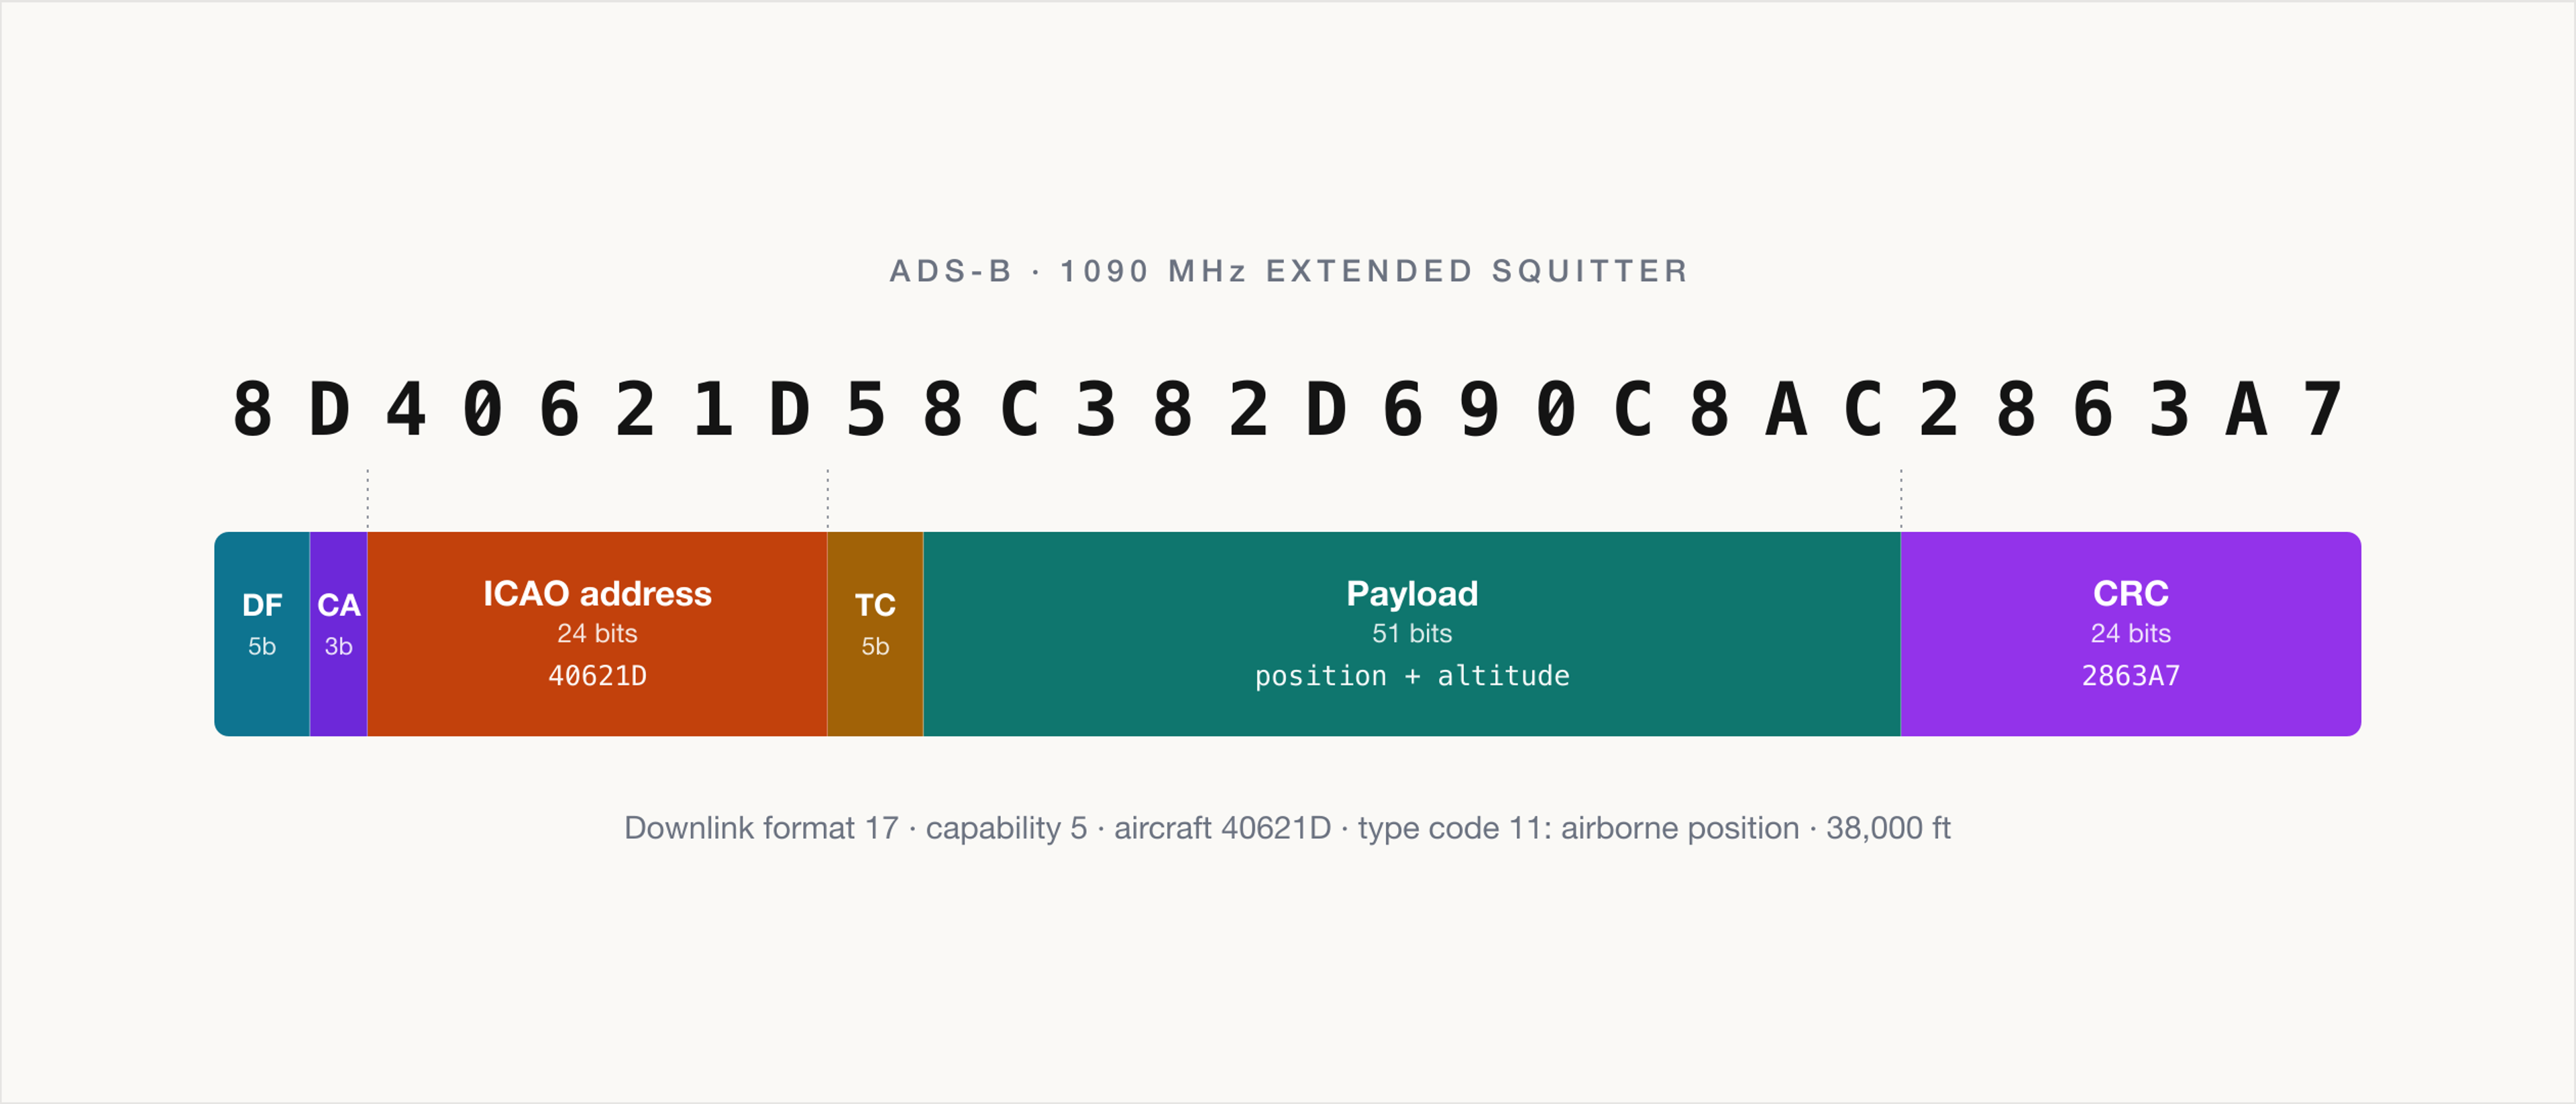
A real 112-bit ADS-B airborne position message, 8D40621D58C382D690C8AC2863A7, decoded into six labeled fields sized in proportion to their bit width: a 5-bit downlink format of 17, a 3-bit capability field, the 24-bit ICAO address 40621D, a 5-bit type code of 11, a 51-bit payload carrying position and altitude, and a 24-bit CRC of 2863A7. The message reports aircraft 40621D in airborne position at 38,000 feet.

What's Actually in an ADS-B Message?

An ADS-B message is 112 bits, sent about twice a second with no handshake. We decode a real one field by field, down to the position it never sends whole.

July 8, 2026
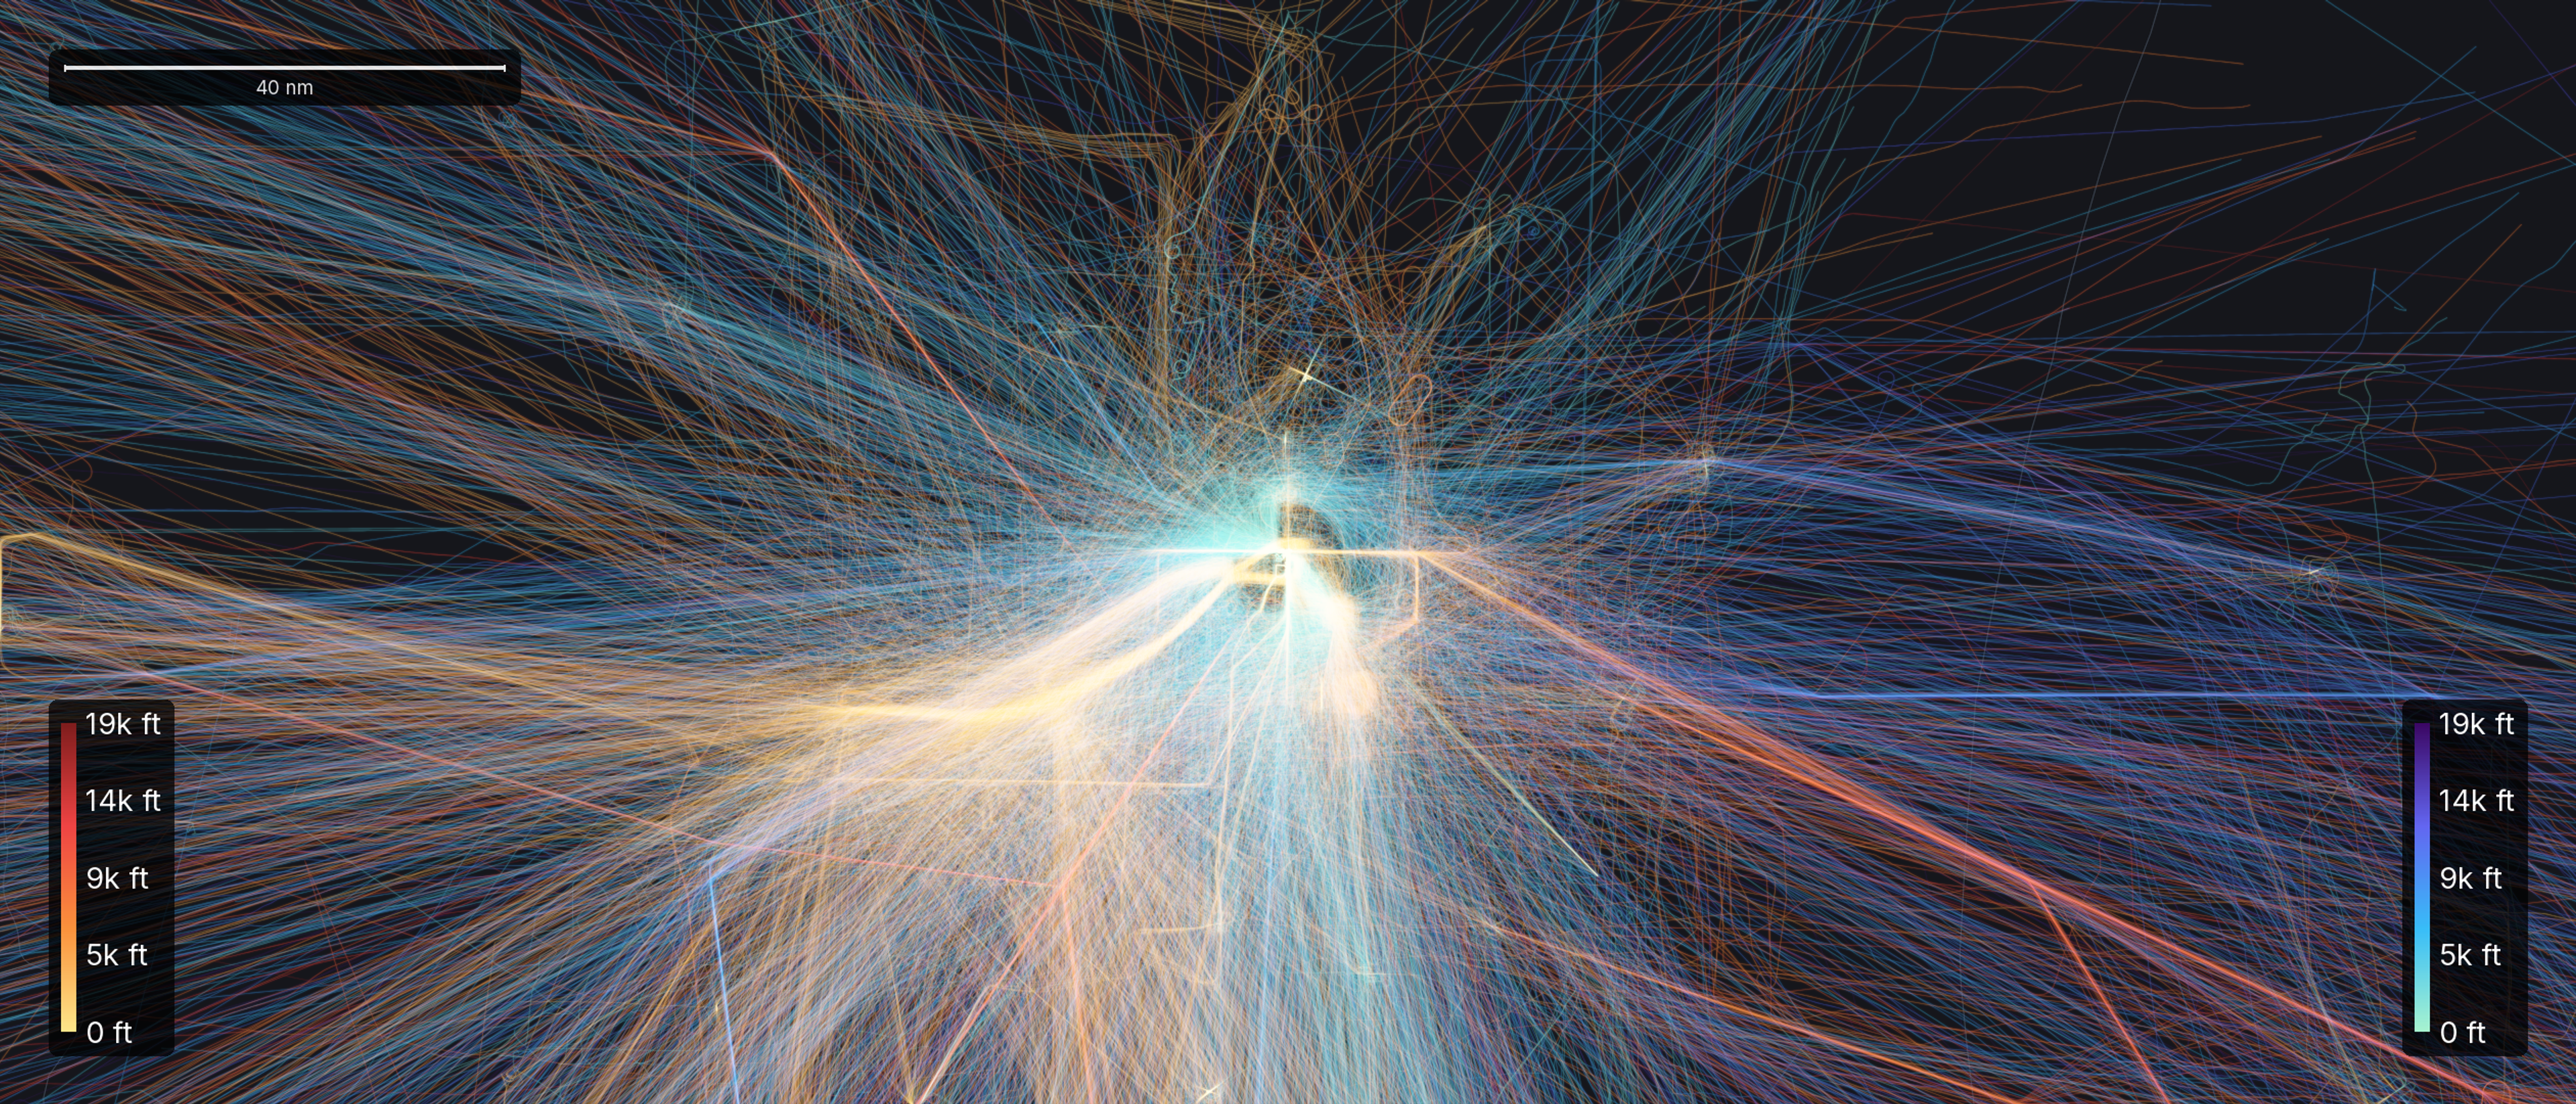
Every aircraft that held over London on February 18, 2026, drawn from ADS-B data across a full day in the London terminal area. Of 996 tracked aircraft, 295 flew racetrack loops over four holding fixes, the ovals blooming brightest where many aircraft flew the same pattern. Tracks are colored by altitude, cyan at low level near the airport and warmer through the stacked holds above, with an altitude scale at the lower left.

What a Holding Pattern Actually Looks Like

On one day over London, 295 of the 996 aircraft we tracked flew racetrack loops, stacked over four holding fixes. This is what a holding pattern looks like.

June 23, 2026
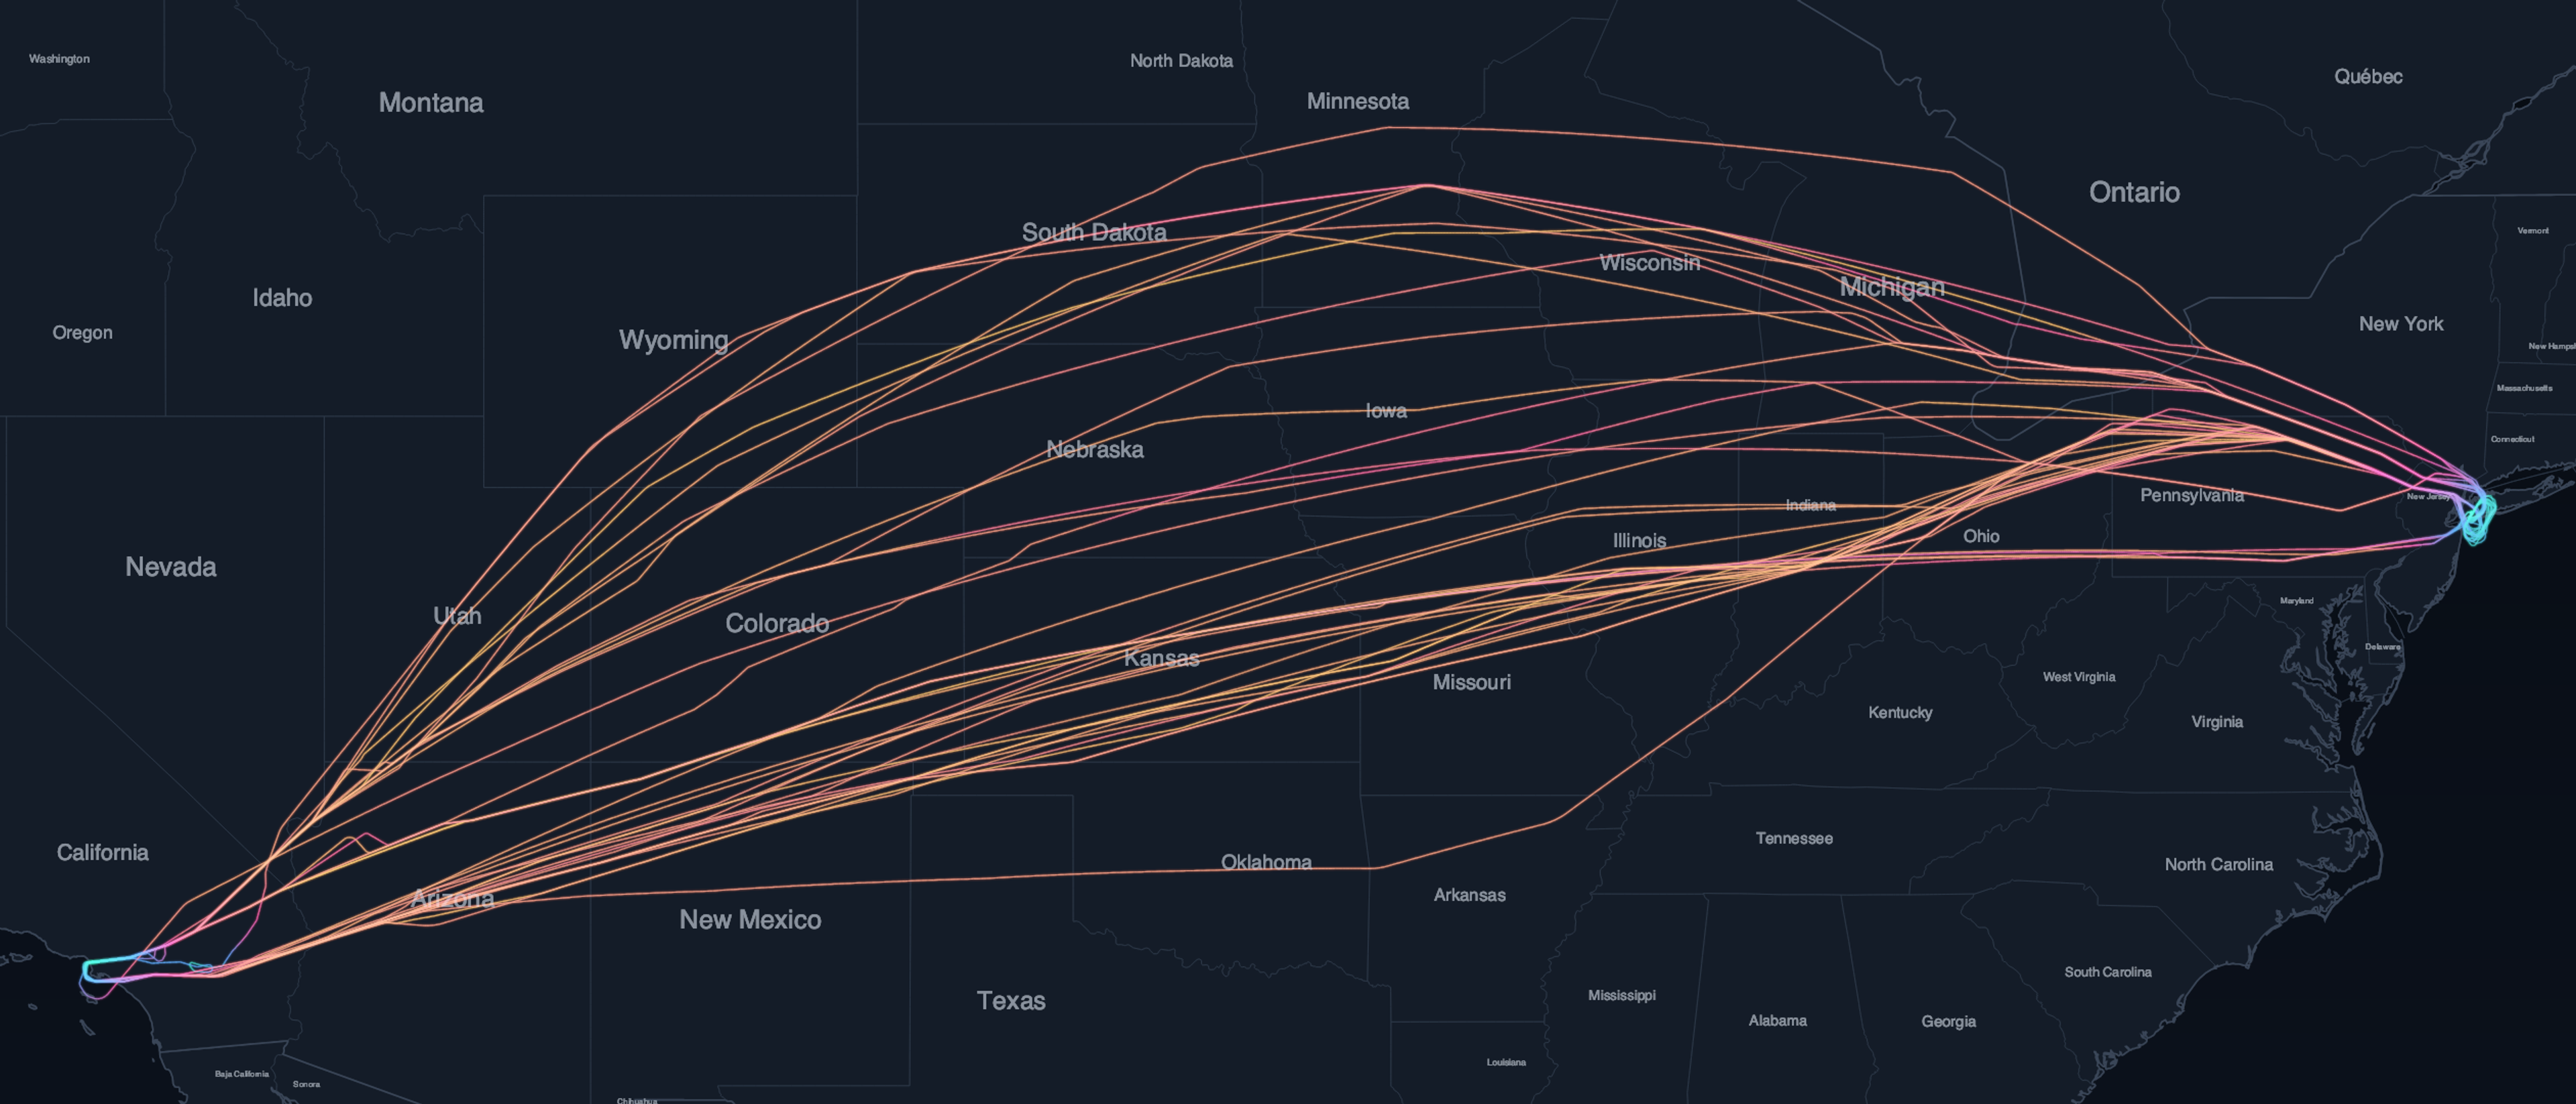
All 38 tracked flights between Los Angeles (KLAX) and New York (KJFK) on February 18, 2026, drawn as a bundle of curving paths that bow north across the United States. Each path is colored by altitude, teal at the low-altitude ends and warm through cruise, and every flight runs longer than the 2,146-nautical-mile straight-line distance.

Why Flight Paths Aren't Straight Lines

The shortest route between two cities looks like a curve on a flat map, and that is only the first reason a real flight path bends and rarely runs straight.

June 20, 2026
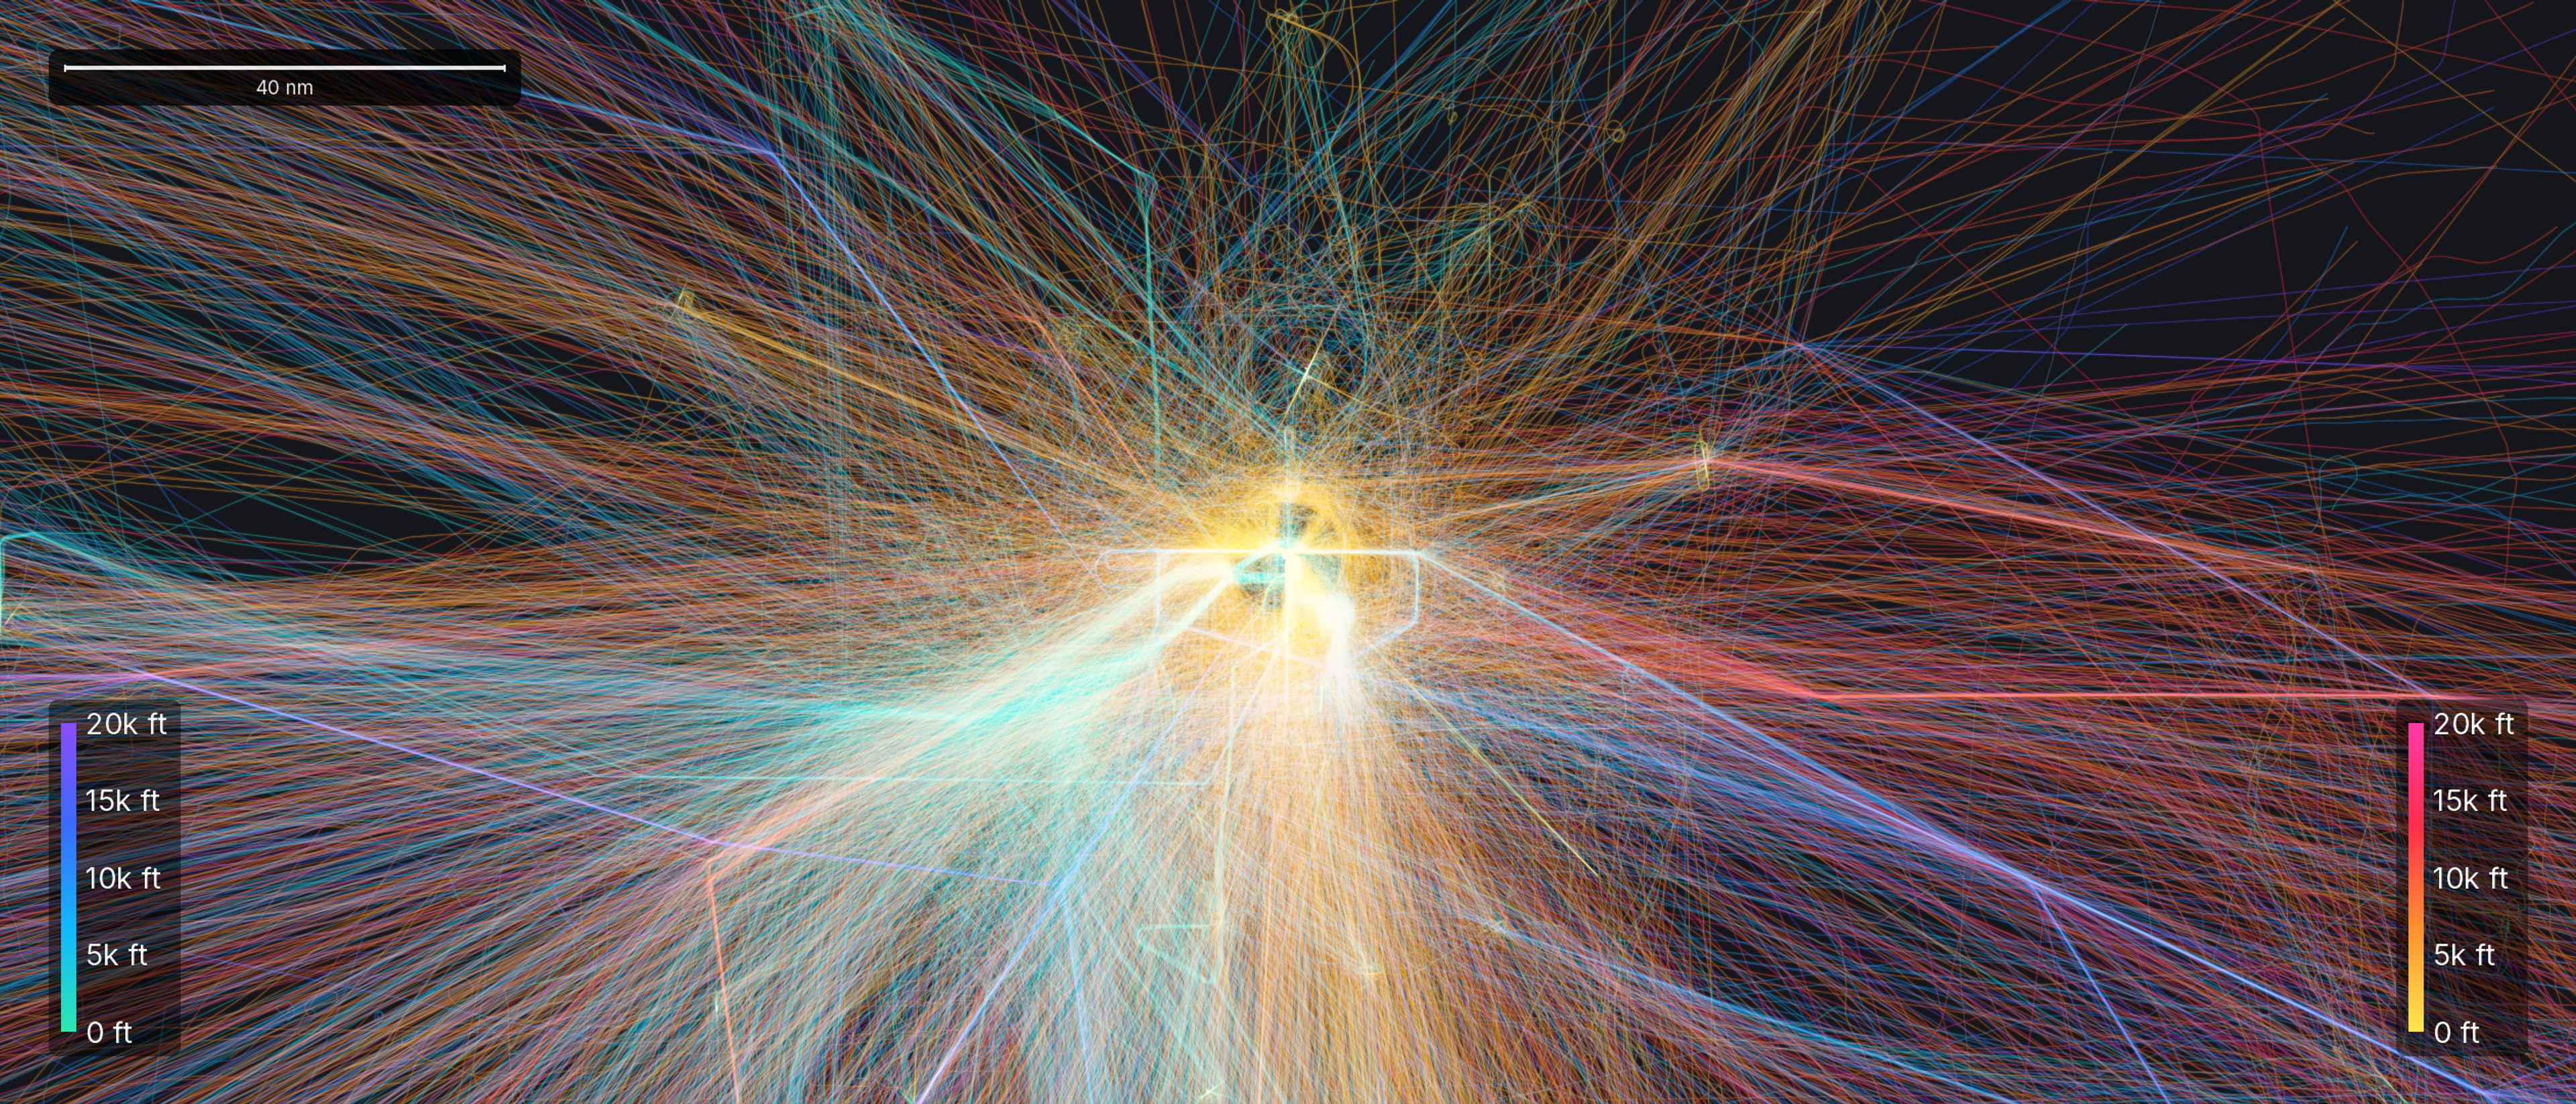
Flight-density map of European airspace built from a single day of ADS-B data, February 18, 2026: 26,284 flight legs from every kind of aircraft, from airliners to light general aviation, covering 13.9 million statute miles, each path colored by its altitude from red at low level to magenta at cruise, over a dark map.

What Is ADS-B, and What Problem Does It Solve?

ADS-B has aircraft broadcast their own GPS position once a second, replacing radar sweeps that refreshed every 5 to 12 seconds and never reached the ocean.

June 20, 2026
Wide-angle ADS-B flight path visualization of the Eastern storm core comparing February 22 and February 23, 2026, spanning 37.50°–44.00°N, 86.27°–66.23°W. Captures the full geographic extent of Winter Storm Hernando's aviation impact across a corridor from the Great Lakes to coastal Maine. February 22 shows 7,513 flight legs with 2,142,863 nautical miles flown; February 23 shows 5,533 legs and 1,253,914 nautical miles — representing 1,022,985 unflown statute miles.

Winter Storm Hernando Eliminates 83% of Northeast Flight Activity: February 23, 2026 ADS-B Analysis

ADS-B data shows Winter Storm Hernando cut New York and Boston flight legs by 83%, collapsed flight hours 90%, and left over 1 million statute miles unflown across the Eastern corridor.

February 28, 2026
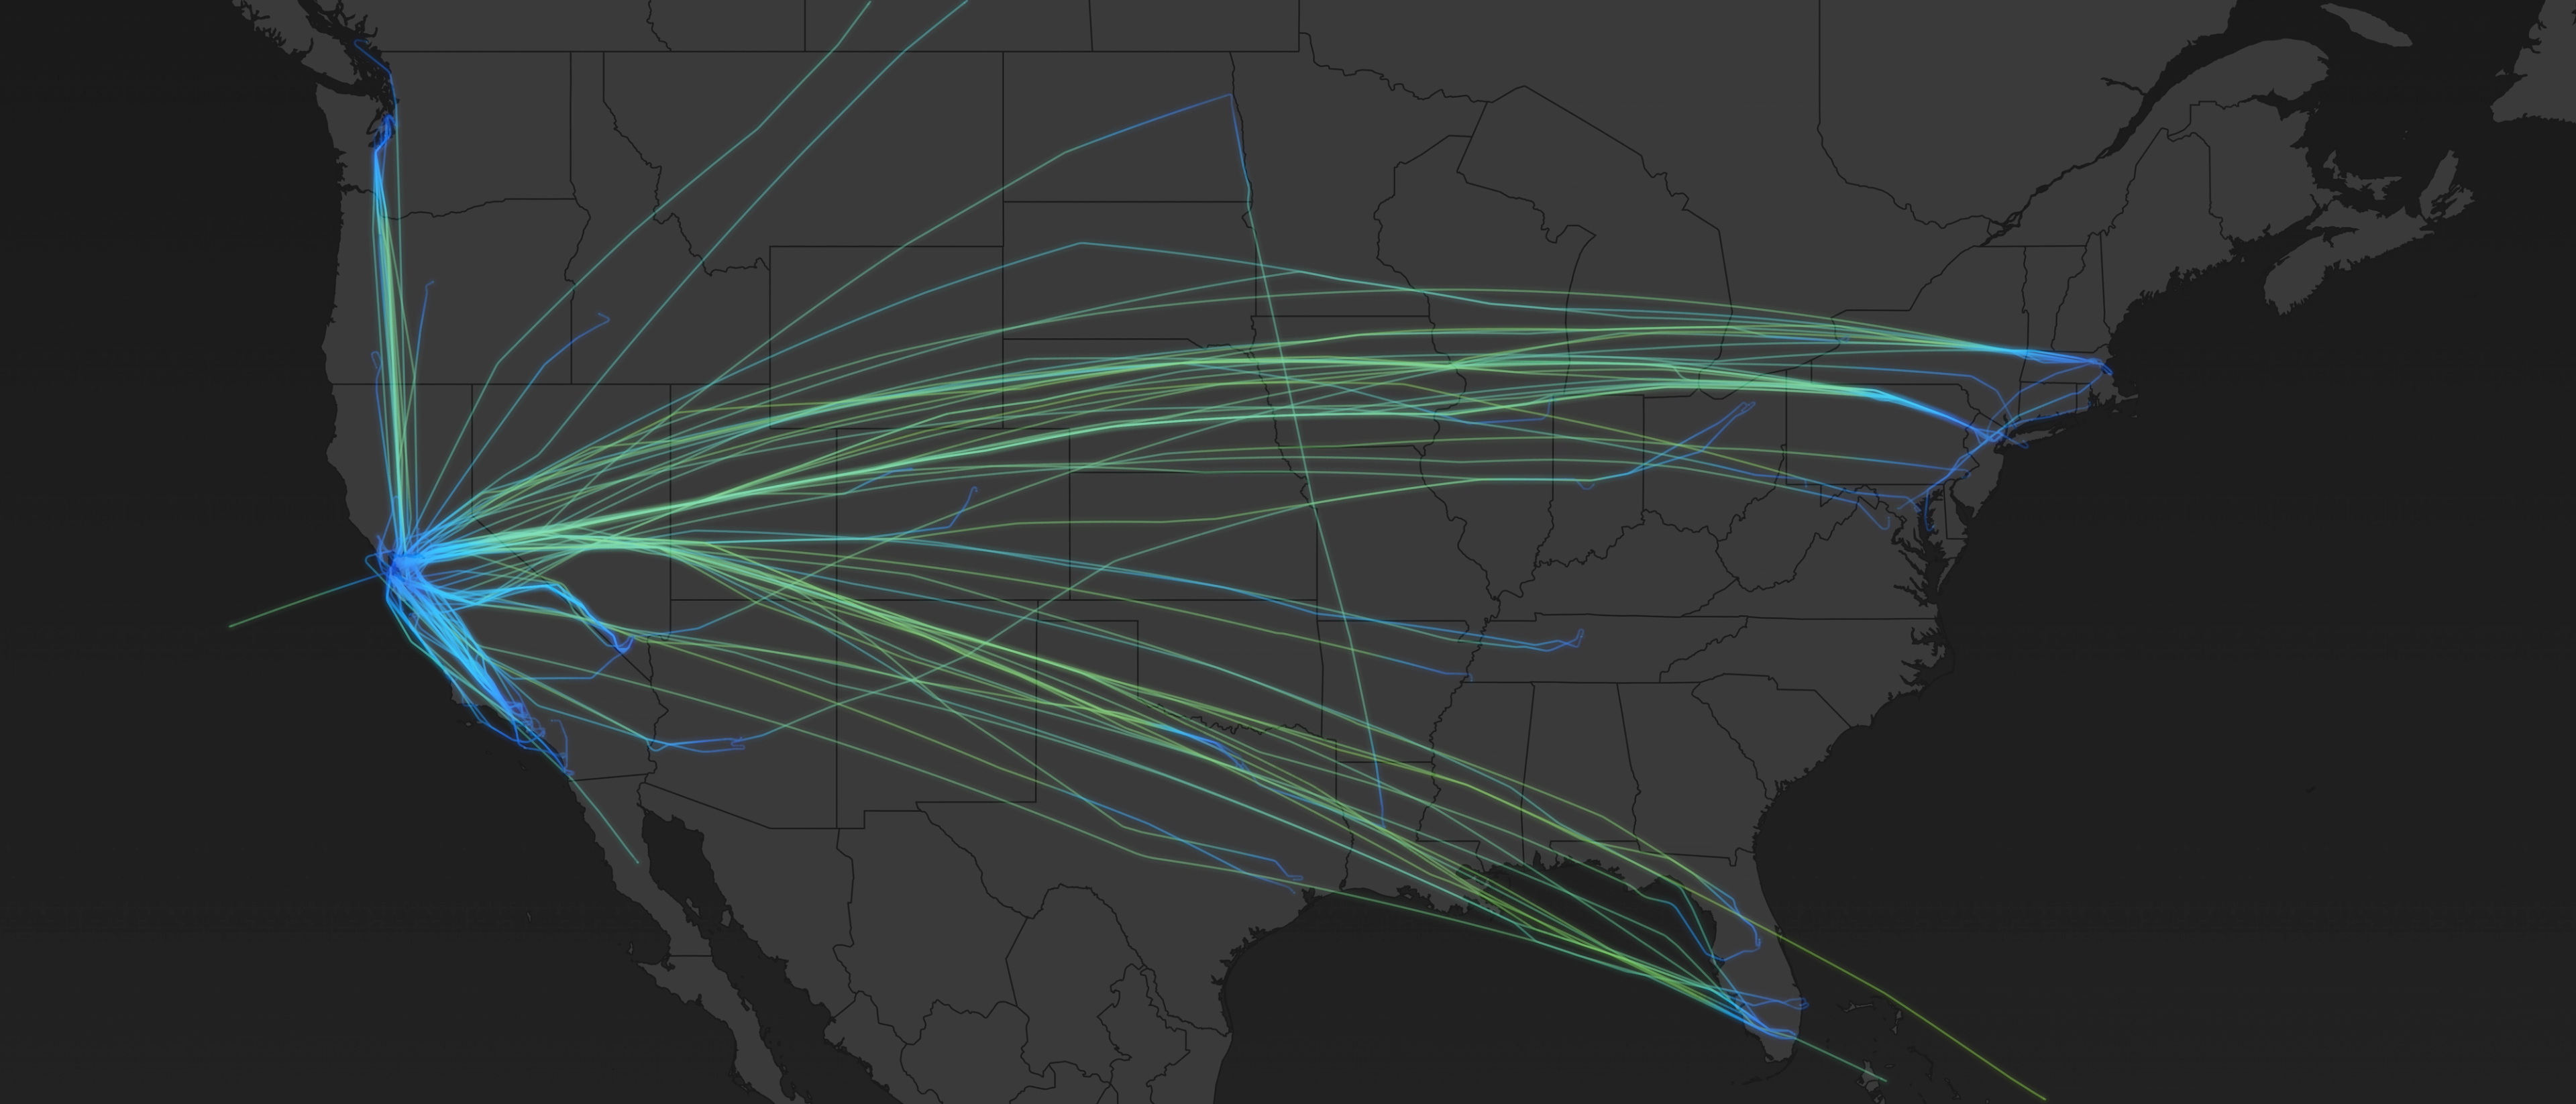
Map visualization showing 132 private jet departure trajectories from San Francisco Bay Area airports after Super Bowl LX on February 8, 2026. Flight paths radiate outward from multiple Bay Area airports (San Francisco, Oakland, San Jose, Hayward, Livermore) toward destinations across the continental United States, with some routes extending to Hawaii, Mexico, Canada, and the Caribbean. Lines are color-coded by departure time from 7:00 PM to 2:00 AM local time, showing concentrated activity between 8:00-9:00 PM.

2026 Super Bowl LX Exodus: Tracking Private Jets

We tracked 132 US-registered private jets departing the San Francisco Bay Area after Super Bowl LX, a 1,550% increase over baseline traffic. The longest flight covered 3,220 nautical miles.

February 12, 2026
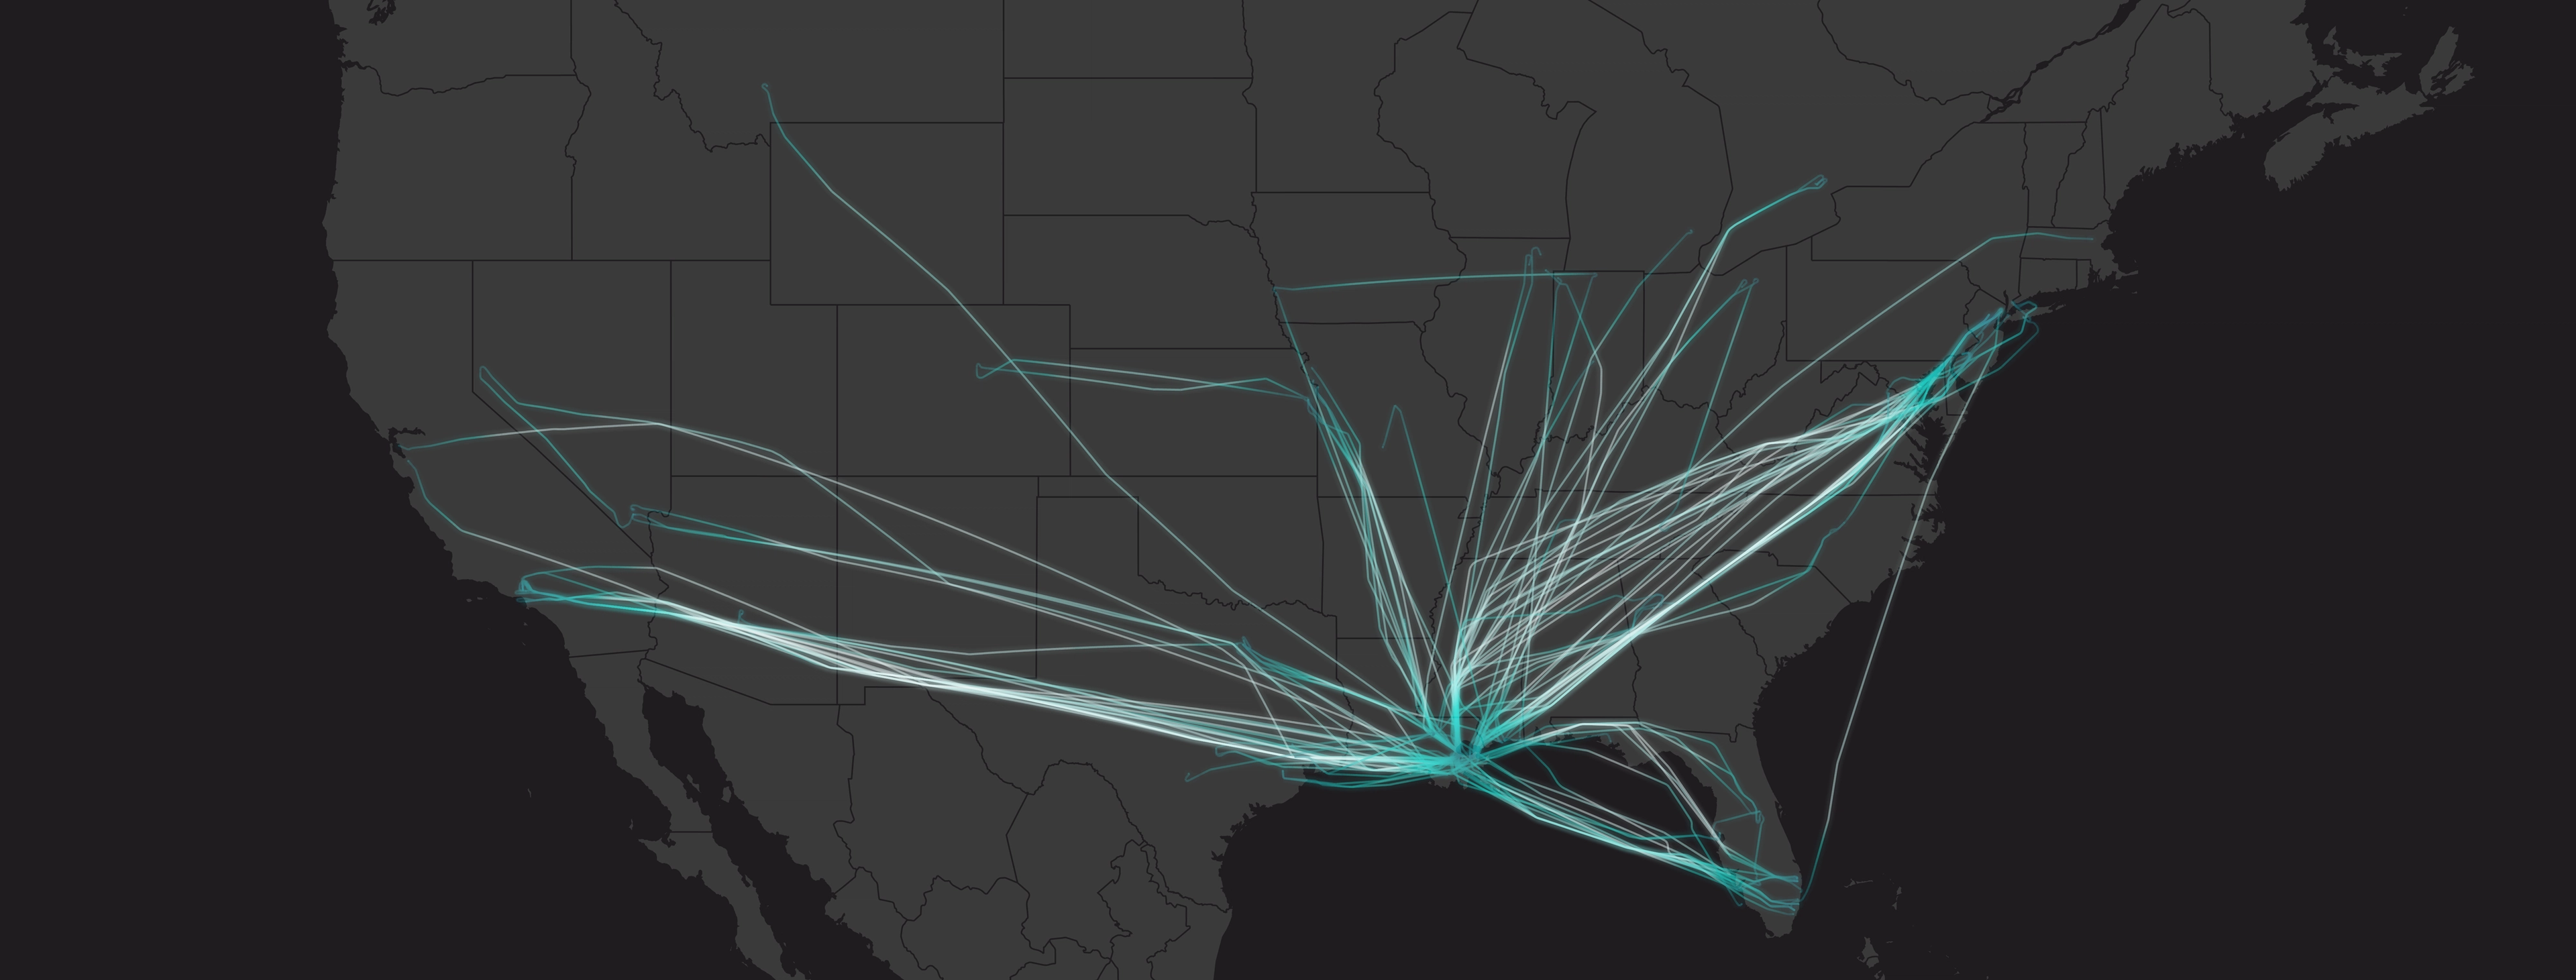
Map visualization showing flight paths of 126 private jets departing New Orleans after Super Bowl LIX on February 9, 2025.

2025 Super Bowl LIX Exodus: Tracking Private Jets

We tracked 126 US-registered private jets departing New Orleans after Super Bowl LIX using ADS-B data. The aircraft covered 113,707 nautical miles in six hours, with the longest flight reaching 2,050 nm. A data visualization revealing the logistics behind moving high-net-worth individuals after the big game.

February 12, 2026
Flight Density Map - January 25, 2026, 12:00-04:00 UTC]

Flight Density Visualized: Winter Storm Fern's Impact on US Aviation

ADS-B data reveals how Winter Storm Fern's 2,000-mile path collapsed the US flight network, causing 15,000+ cancellations, the worst disruption since COVID.

January 28, 2026

Never Miss a Story

Subscribe for new aviation stories, flight visualizations, and exclusive updates.

No spam, unsubscribe anytime.