For one week each summer the Experimental Aircraft Association holds AirVenture at Wittman Regional in Oshkosh, Wisconsin, and the FAA staffs the control tower there as one of the busiest in the world. In 2026 the association counted 734,000 people through the gates, the largest attendance in the event's history. The FAA counted 15,527 aircraft operations at the field between noon on July 16 and noon on July 27, about 101 takeoffs and landings an hour across the hours the tower was open.
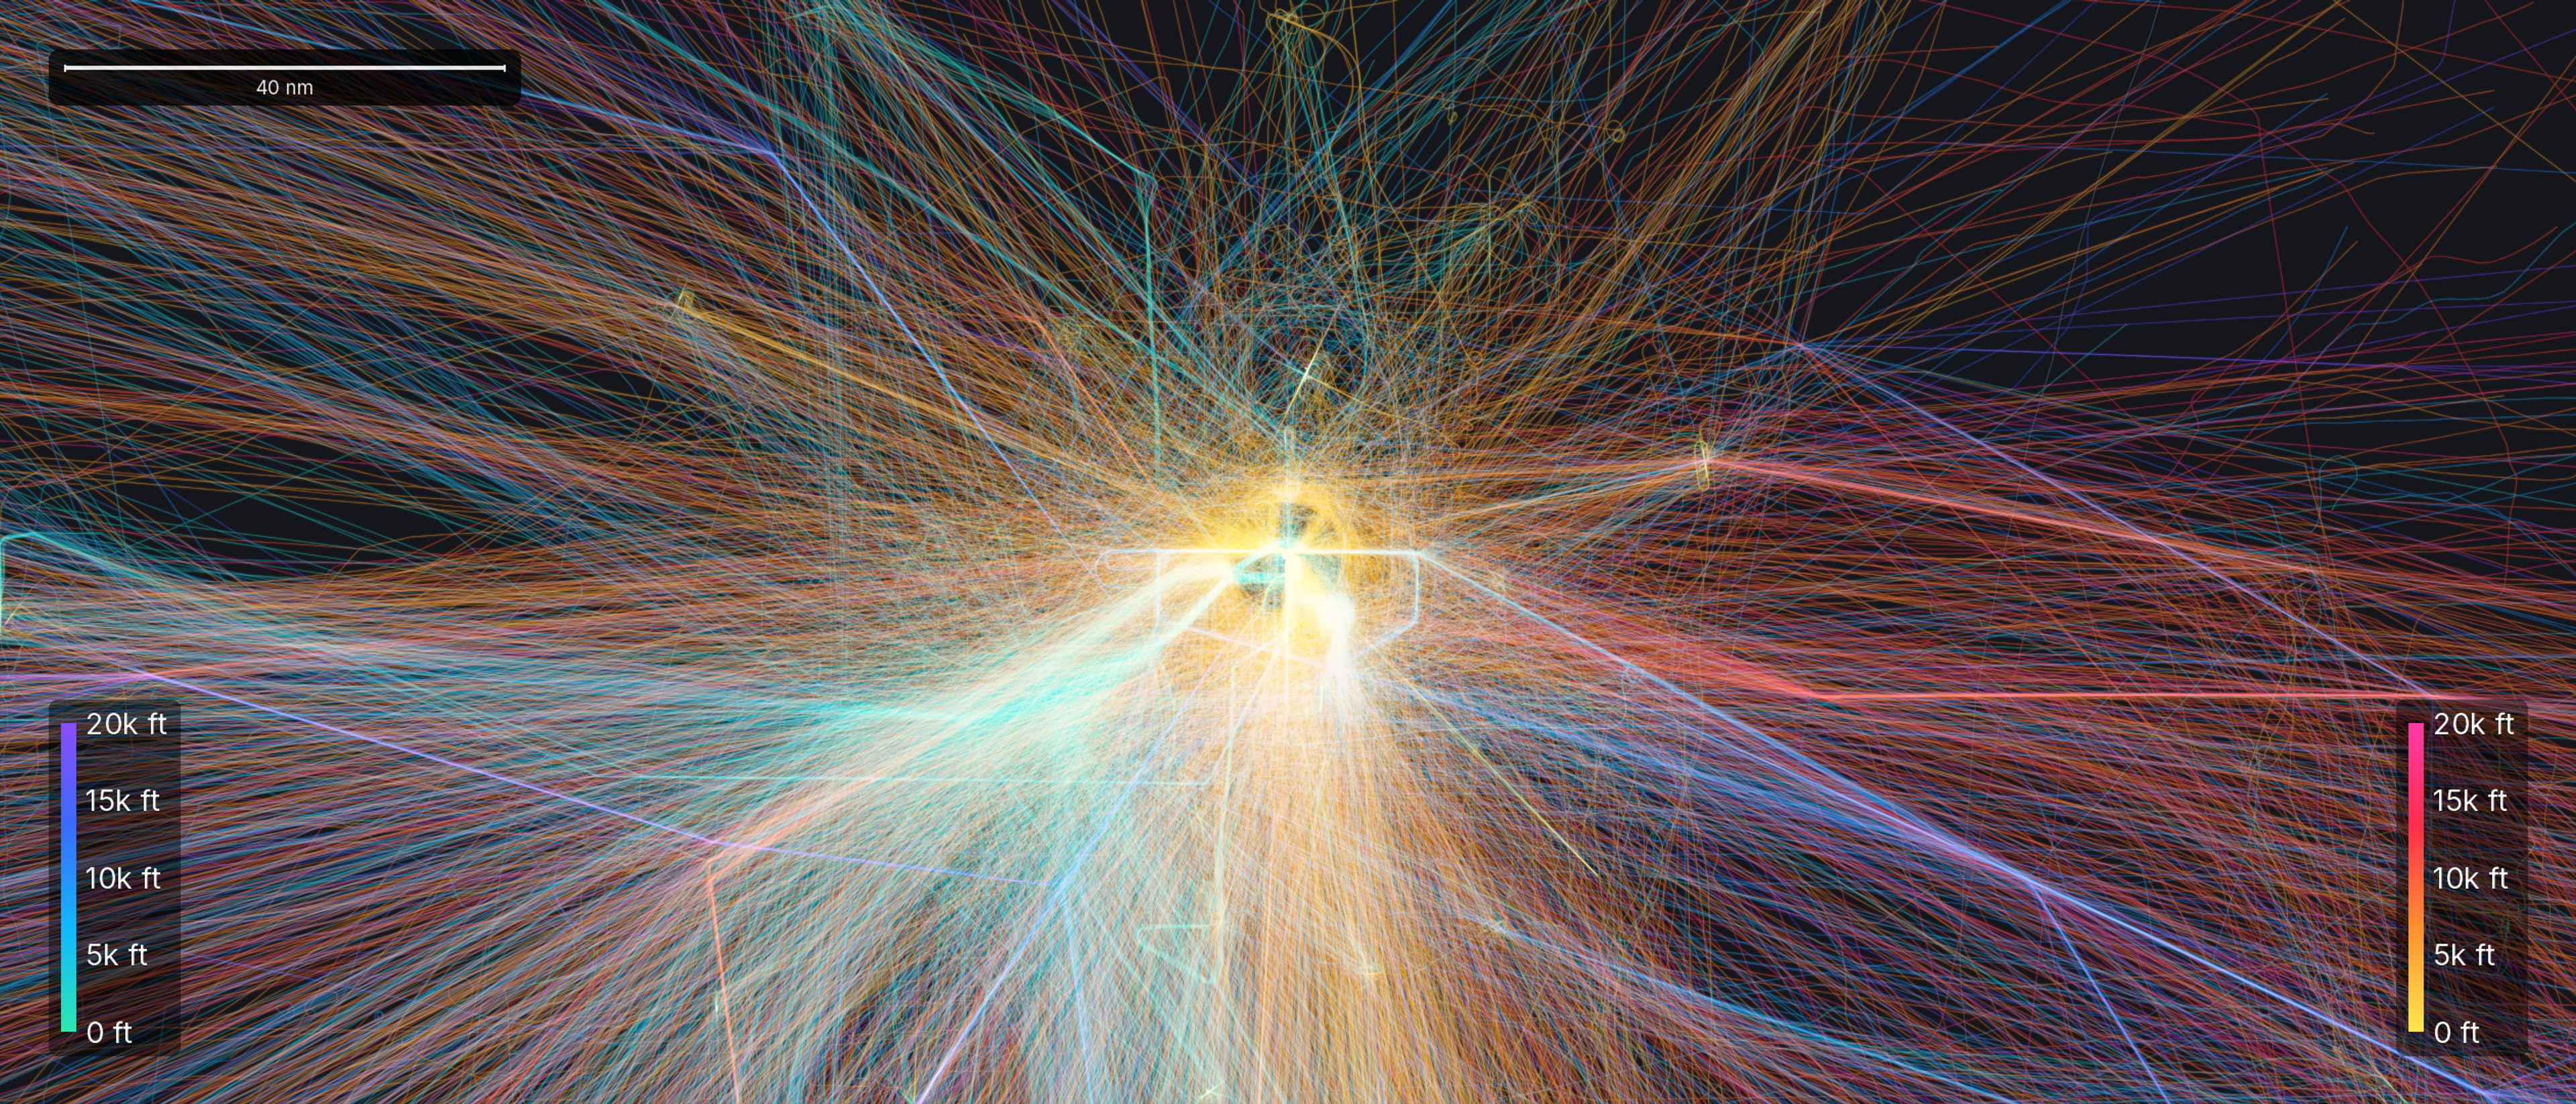
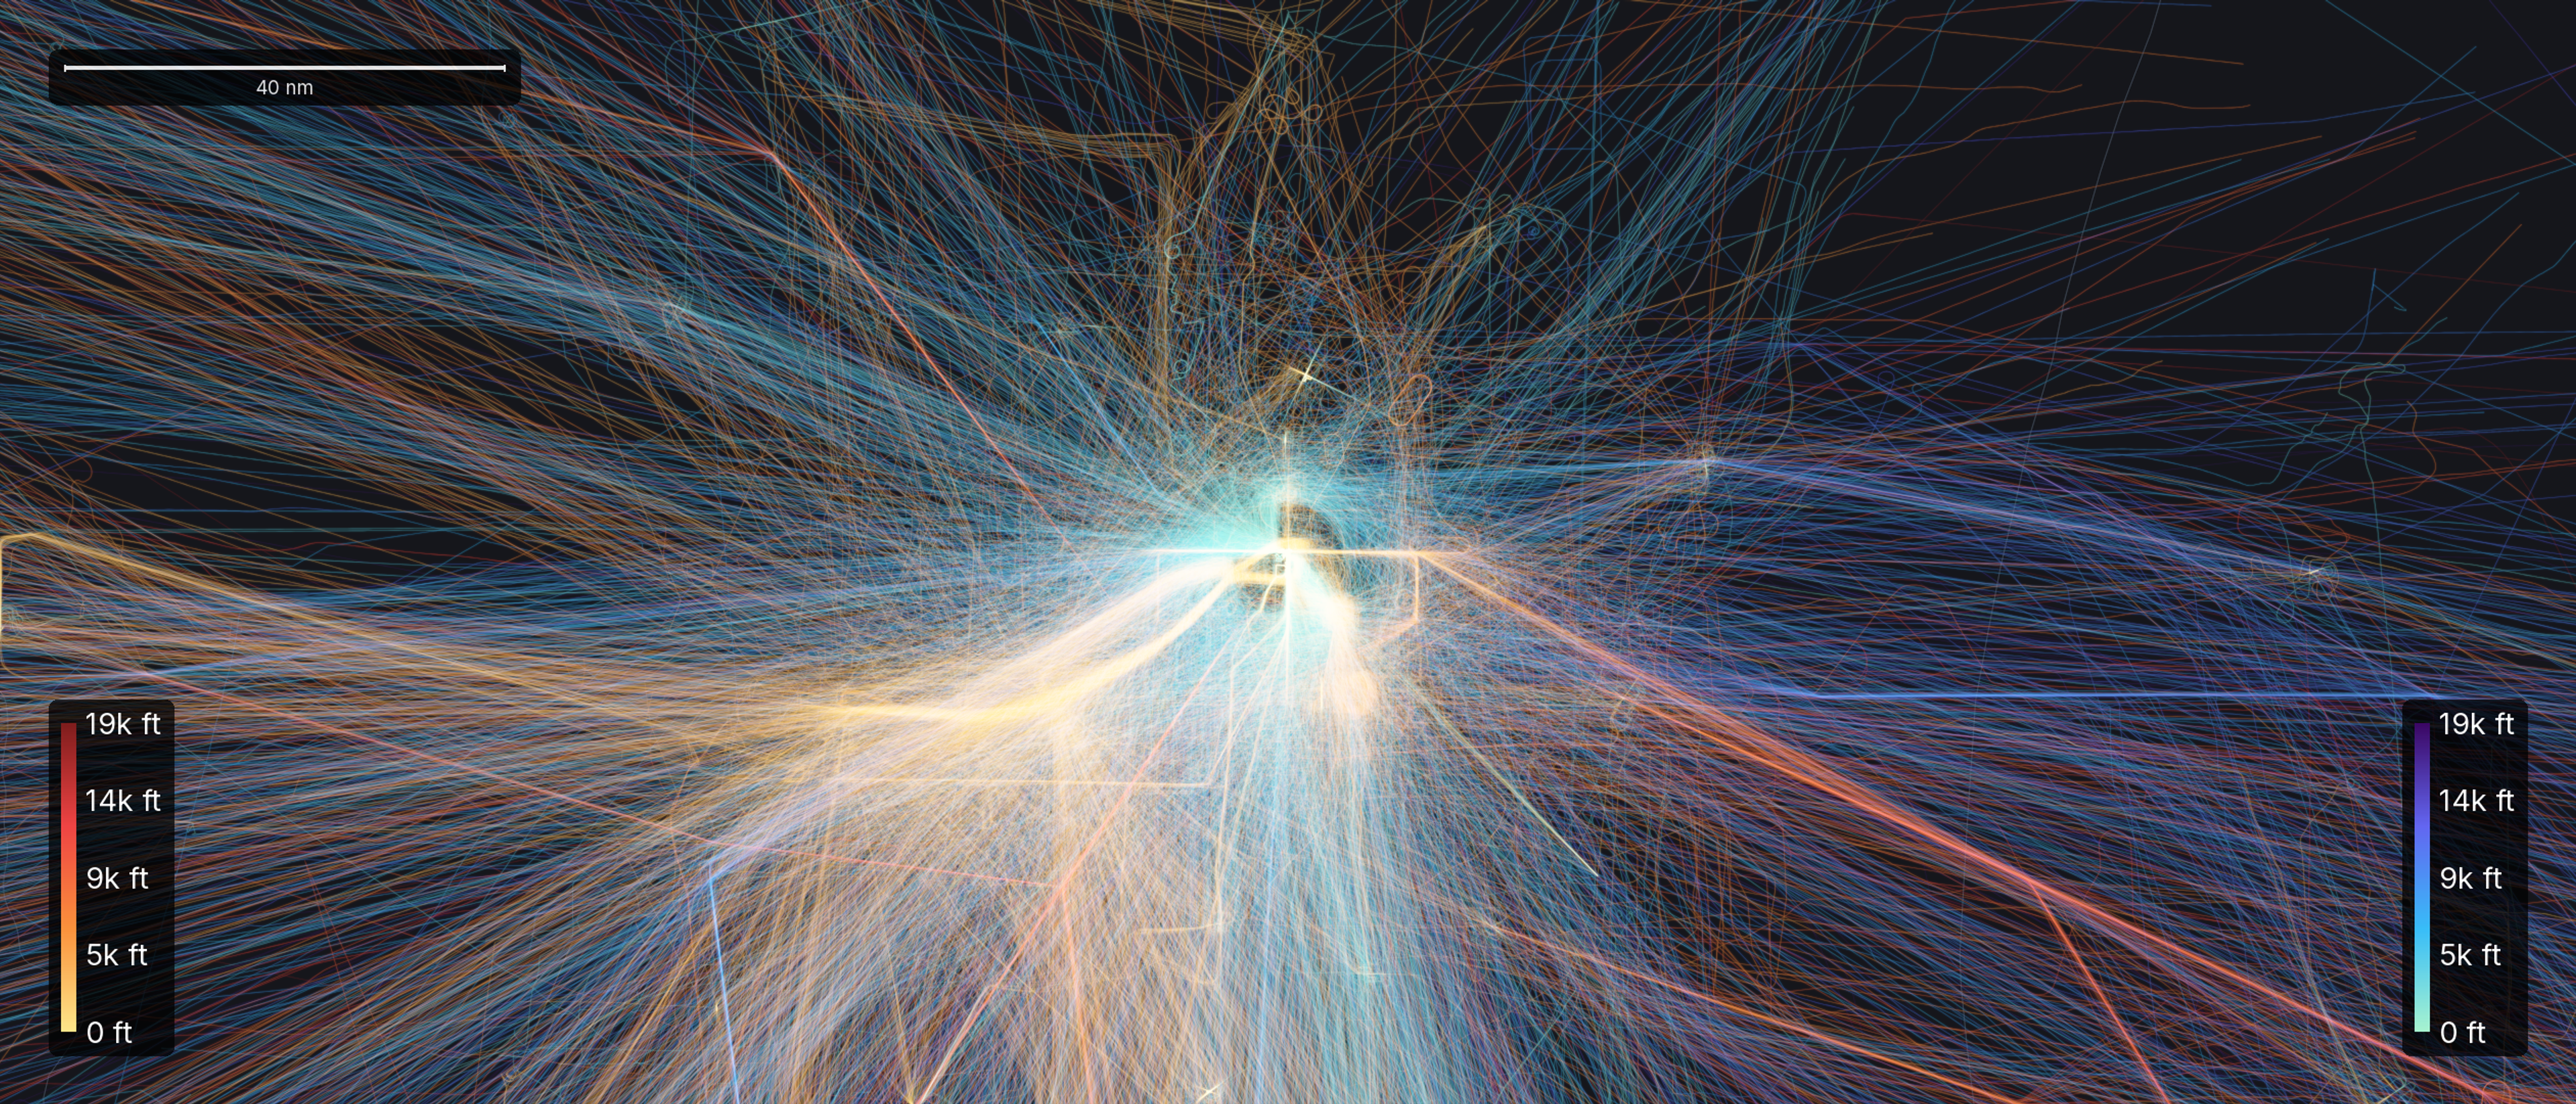
Both of those are counts from the ground. We tracked the sky above them instead. Aircraft broadcast their position about twice a second, and those broadcasts are what this article counts. From July 15 to 27 we tracked 9,803 arrivals and departures at Oshkosh, flown by 4,956 aircraft. In the busiest single hour, 8 a.m. on Thursday July 23, 292 came or went. That is one movement every twelve seconds.
flights tracked
9,803
aircraft
4,956
busiest hour
292movements
people through the gates
734,000
Sorting the stream at Fisk
The tower earns its title with a procedure built for the volume, and the procedure is published in advance. Pilots arriving under visual flight rules fly to the town of Ripon, pick up the railroad tracks, and follow them northeast to Fisk at 1,800 feet and 90 knots. Aircraft unable to maintain 90 knots fly the same route 500 feet higher and 45 knots faster. Controllers stationed at Fisk sort the stream by type and color. The frequency is one way, so a pilot answers by rocking the aircraft's wings. That is both the acknowledgment and how the controller knows which airplane replied.
Those two numbers are published months ahead, and pilots fly them from memory. They are visible in the data.
338 of the arrivals we tracked begin already established on the route, their first recorded position a median 17.1 nautical miles out, a little short of Ripon. 289 of those 338 approach from the west-southwest or southwest. Of the 318 that reported an altitude at that first point, 262 crossed it between 1,600 and 1,999 feet.
These are 326 different aircraft, so the cluster is not one airplane flying the route again and again. It sits a little below the published figure rather than centered on it. That offset is most likely instrumental: the altitude in an ADS-B broadcast is referenced to a standard pressure setting, while the pilot is flying 1,800 feet on the local altimeter setting, and the two differ by whatever the pressure was that day.
Those flights have no resolvable origin in our data: their tracks begin over open country where the nearest airport carrying a published identifier is Wittman itself. A further 401 arrivals resolve to no airport at all. The feeder fields below therefore cover the 4,113 arrivals that do resolve to another airport.
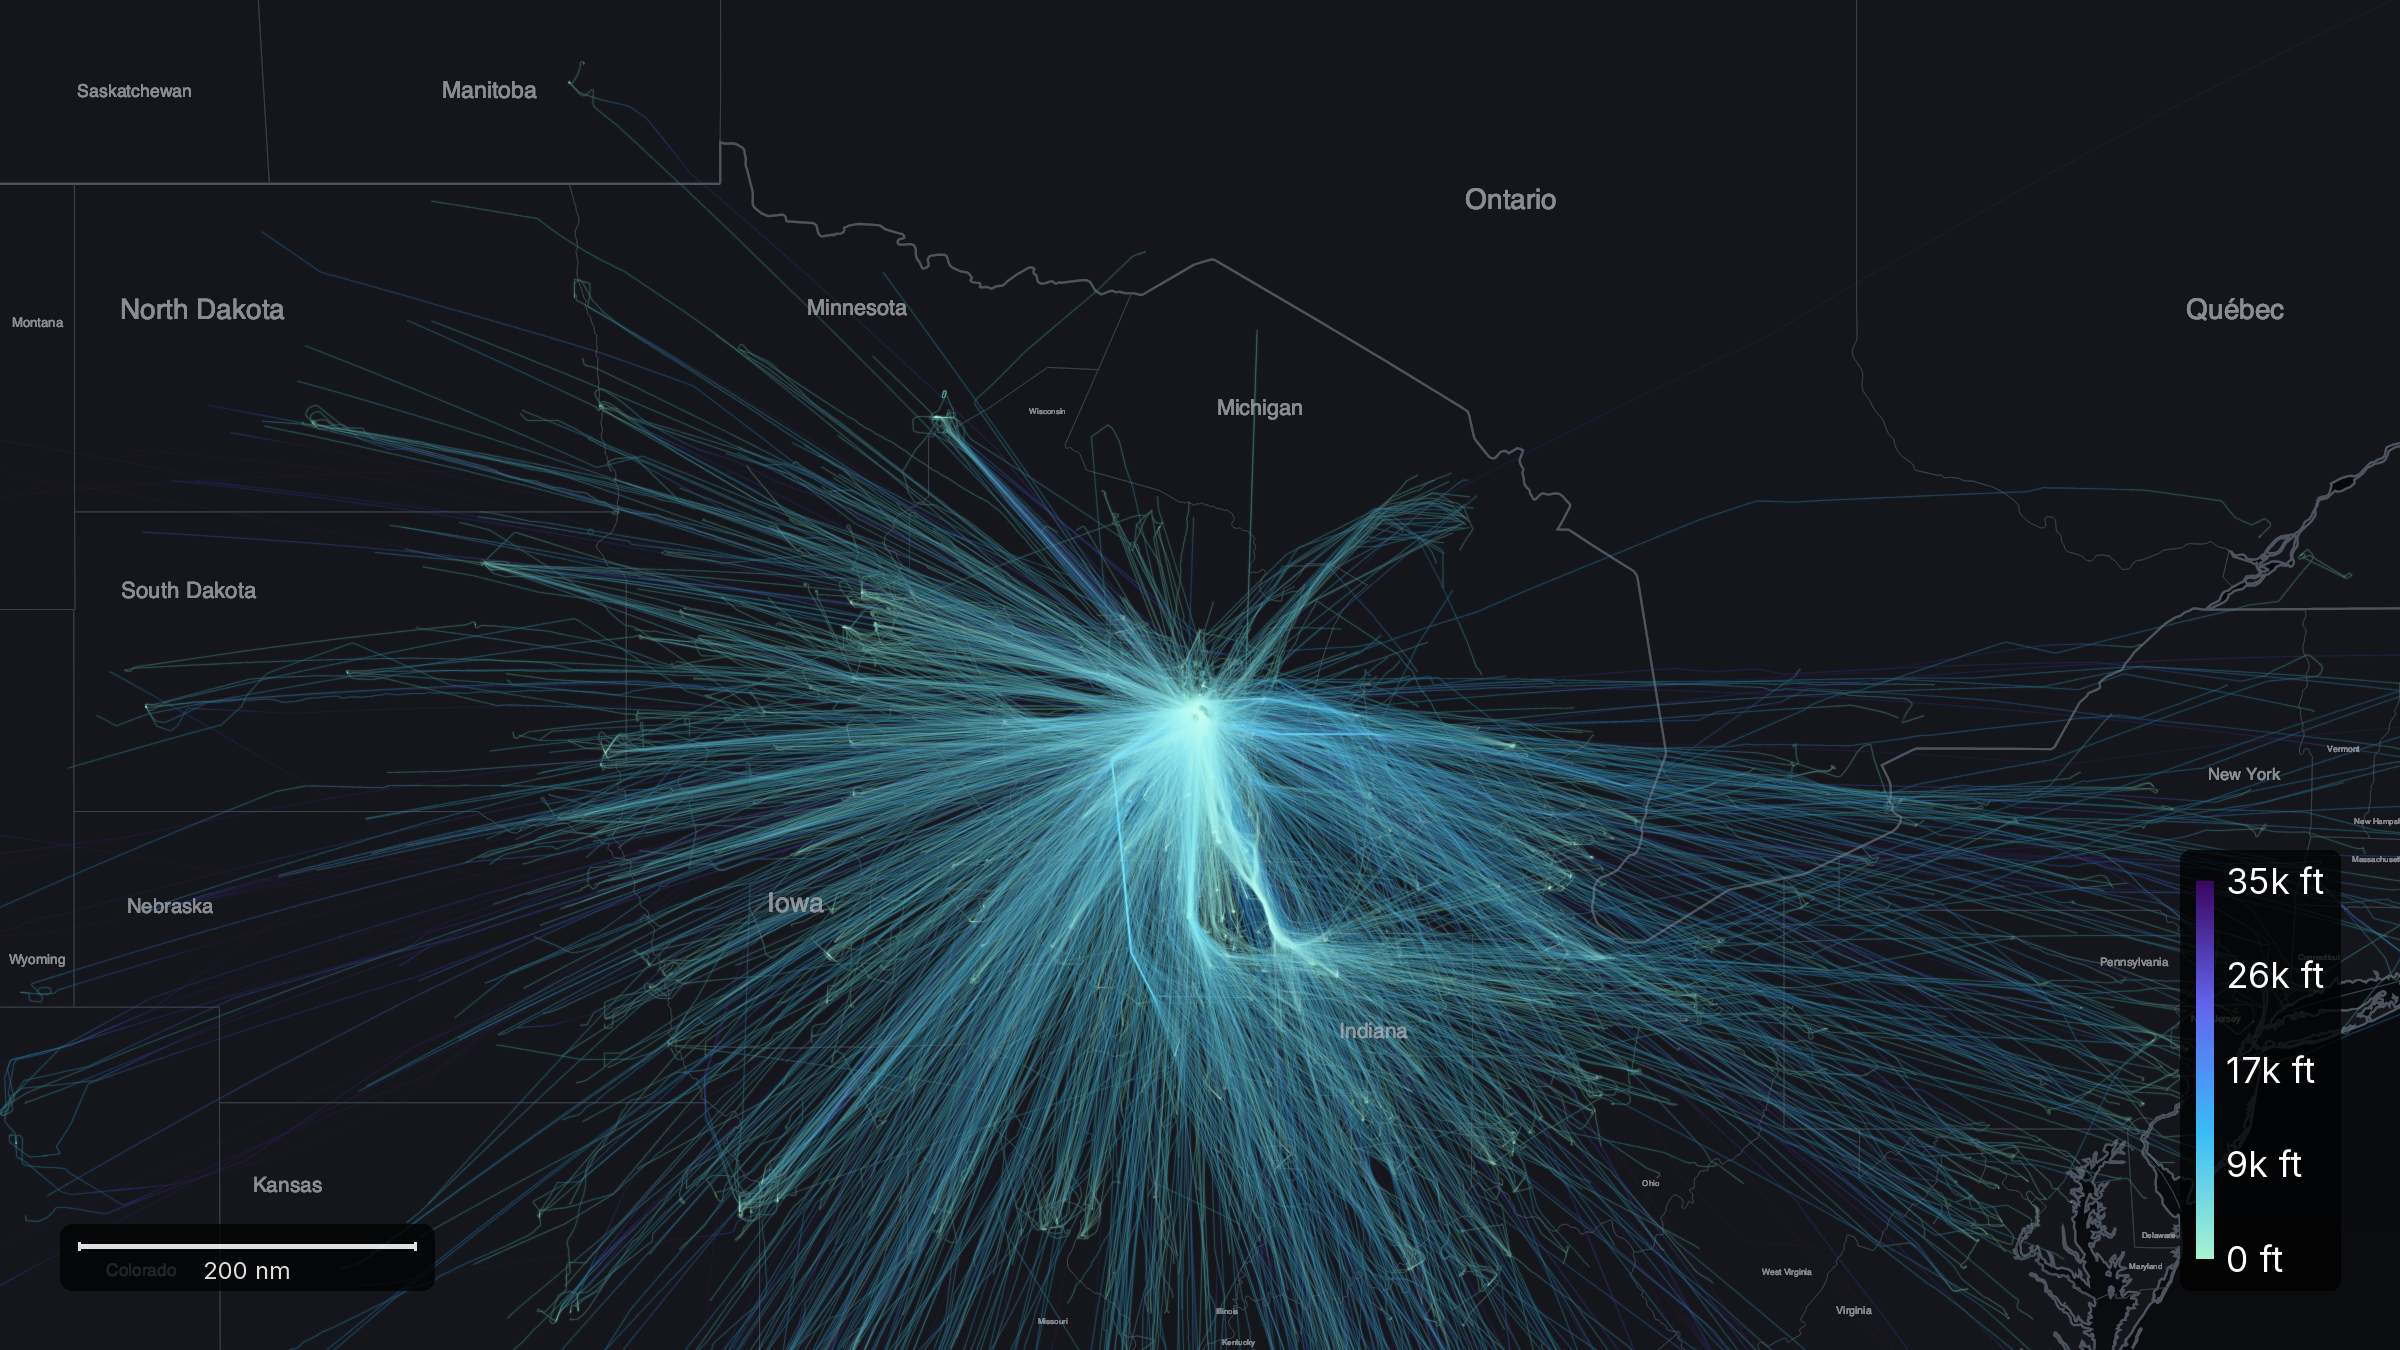
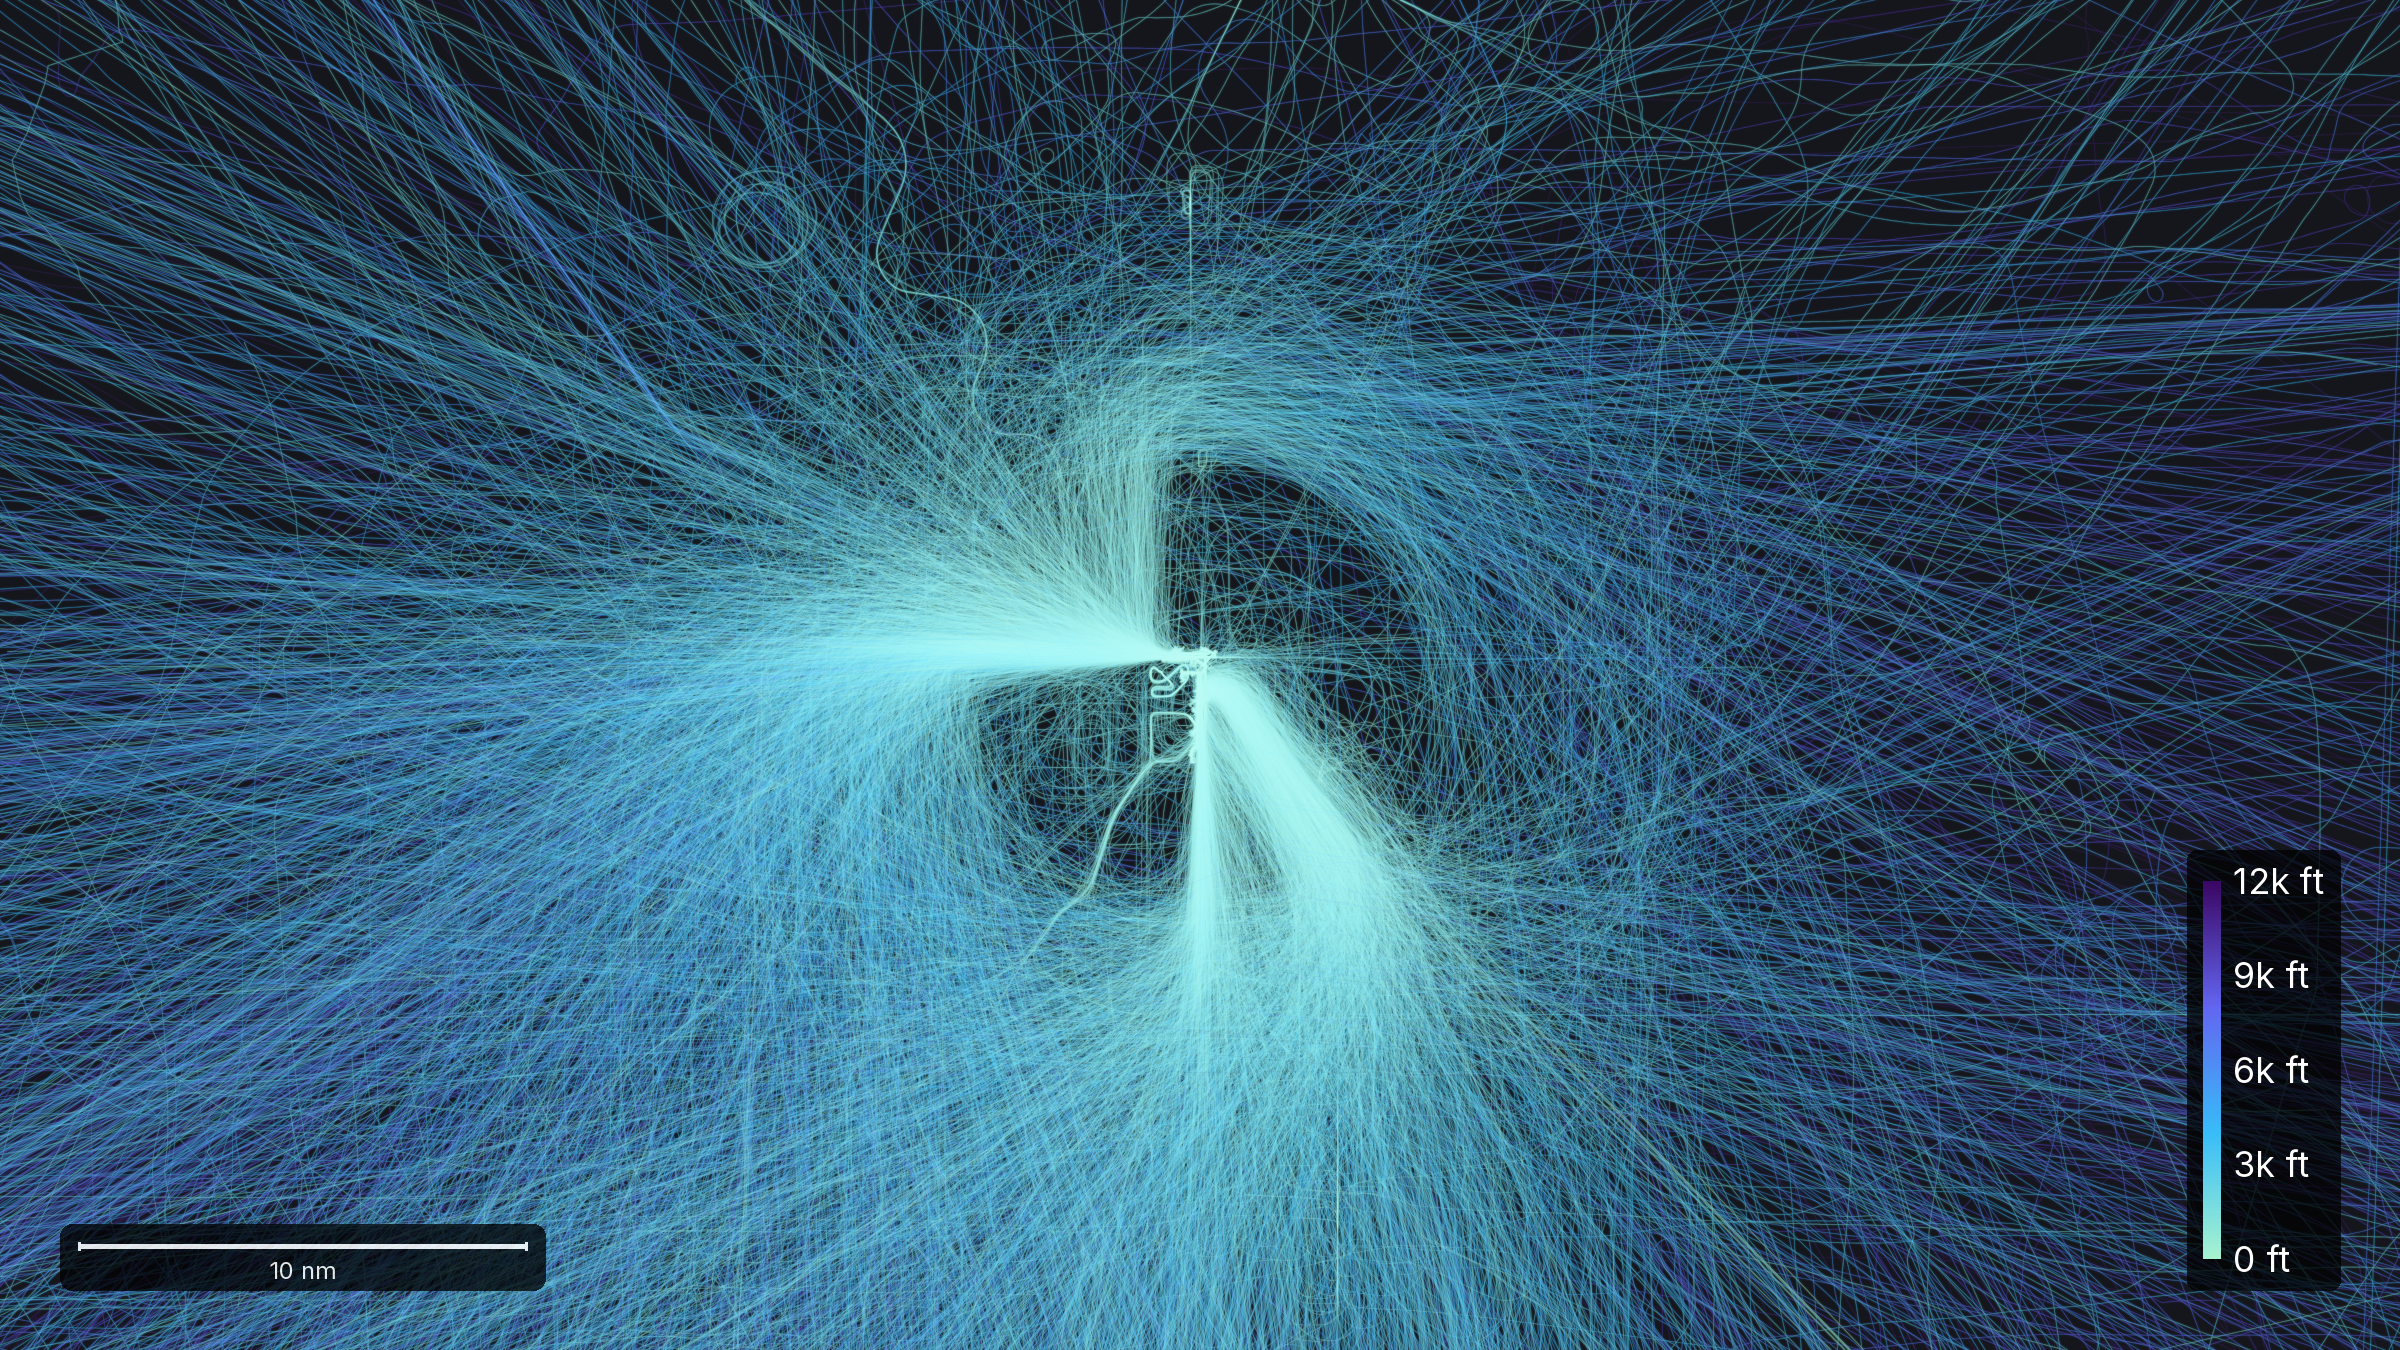
Every arrival and departure we tracked is below.
KOSH · July 15 to 27, 2026
Every arrival and departure we tracked at Oshkosh
Six days in, two waves out
Counted by day, the fly-in has a shape. Arrivals come first and hold a three-day plateau across July 17, 18 and 19 rather than spiking on the eve of the gates. Departures take over from there, cross the arrivals on July 23, and peak the same day at 1,492, the single biggest day of the week. That Thursday exodus is not an artifact of one year: the 2025 fly-in peaked on its own Thursday too. A second wave leaves on the closing Sunday.
Mornings out, afternoons closed
Pool all thirteen days into a single day and the airport's schedule shows through. It shows most sharply in the departures, which we count at the moment of takeoff. The field opens to them at 6 a.m. and 438 leave in that first hour, against 14 in the hour before. The push runs hardest from 7 to 9, peaking at 832 between 8 and 9, aircraft that flew in earlier heading home in the cool morning air.
Then departures nearly stop. Between 3 and 4 p.m. we counted 12 across all thirteen days, because the field closes to arriving and departing traffic for the afternoon airshow. Takeoffs resume in a burst when it reopens, 418 between 6 and 7 p.m.
The arrivals curve reads differently, and the difference matters. We count an arrival where its track ends. That is usually the landing, but it is also where a track fades on approach or in a hold. So the 377 arrivals in the 3 p.m. hour are not 377 landings onto a closed field. They are tracks that ended in that hour, and we cannot tell from the data alone how many of those aircraft were on the ground.
This is overwhelmingly a daylight operation flown under visual flight rules, with one clear exception in the data: 543 flights climbed past 18,000 feet, which is Class A airspace and requires an instrument flight plan. The evenings are quiet even when the show is not. AirVenture ran night airshows on Wednesday July 22 and Saturday July 25, and across both of those evenings combined we tracked two movements after 8 p.m.
Arriving together
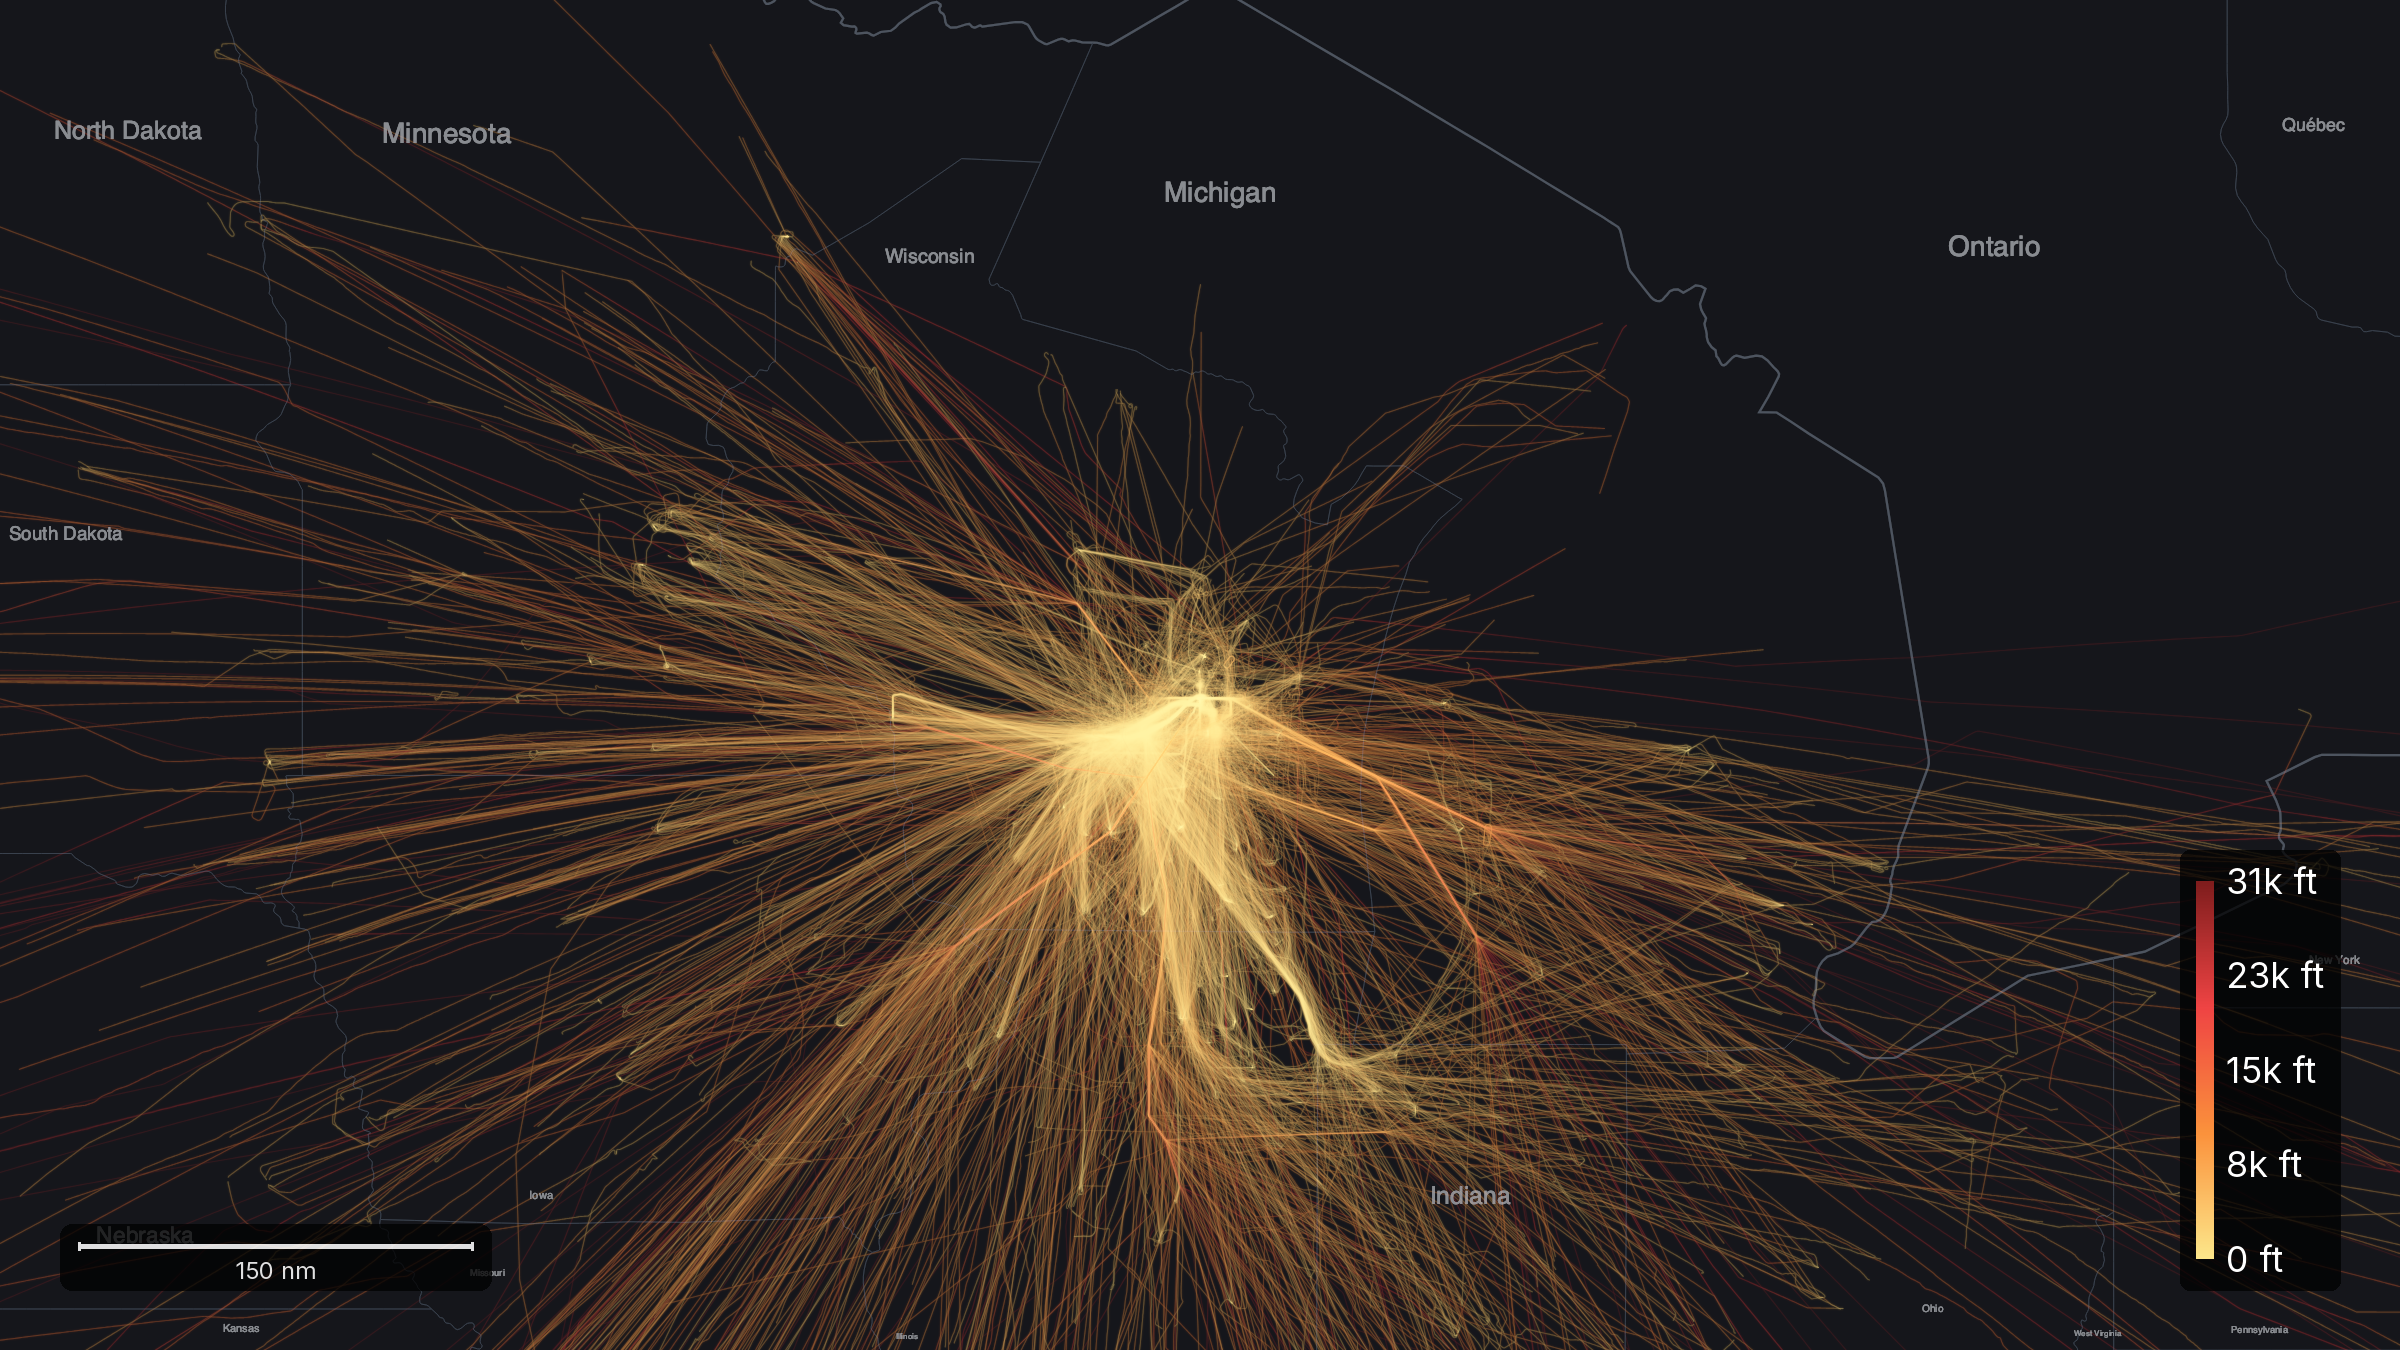
The traffic leans south. Arrivals came mostly from the south and the west-southwest, departures left to the south and southeast. Almost nothing came from or went to the north, where there is little population until the Upper Peninsula, though Appleton is nineteen miles up the road and sent 71 arrivals. The single largest arrival bearing is west-southwest at 975 flights, the quadrant the Ripon route runs through.
The fields that feed Oshkosh are nearby: Juneau, Madison, Fond du Lac, Lone Rock, Janesville. But they do not dominate. The top twelve together account for 1,733 of the 4,113 arrivals that resolve to another airport, so the other 58 percent came from somewhere else.
The reason the top of that list looks the way it does is that AirVenture runs organized mass arrivals. A type club gathers at one airport, briefs there, and flies in together as a single stream on its own arrival slot rather than through Fisk. Four of them are legible in our data, and each one shows up the same way: a burst of arrivals from a single field, seconds apart, nearly all of one make.
The largest is Bonanzas to Oshkosh, which stages and briefs at La Crosse and held the 1 p.m. arrival slot on Saturday July 18. Between 13:05 and 13:23 we tracked 27 aircraft landing at Oshkosh from La Crosse, a median of 30 seconds apart, and every one was a Beechcraft. The group flew 105 aircraft that afternoon, 93 Bonanzas and 12 Barons, so these 27 are the share we saw.
Earlier that morning, from 09:49, 14 arrived from Madison and 12 of them were Mooneys. Late that afternoon the Cessna group came in from Dodge County at Juneau: 22 arrivals between 16:54 and 17:18, a median of 36 seconds apart, 21 Cessnas and one Reims-built Cessna. And on Sunday afternoon 18 arrived from Janesville, 17 of them Cirrus.
Juneau also supplies the control, which is what makes the pattern convincing. The Friday before, its densest 25 minutes brought 22 arrivals, exactly the same burst size as its Saturday mass arrival. Those 22 were nine Cessnas, three Pipers, two Aeroncas, two homebuilts, single examples of five other makers, and one that did not resolve. Same field, same number of aircraft, twenty-six hours apart. One burst is nine makers. The other is one.
- 1KUNU324Dodge County, Juneau WI
- 2KMSN257Dane County, Madison WI
- 3KFLD208Fond du Lac County WI
- 4KLNR204Tri-County, Lone Rock WI
- 5KJVL146Southern Wisconsin, Janesville
- 6KARR102Aurora Municipal, Illinois
- 7KUES99Waukesha County WI
- 8KENW98Kenosha Regional WI
- 9KLSE84La Crosse Regional WI
- 10KDPA77DuPage, West Chicago IL
- 11KATW71Appleton International WI
- 12KVOK63Volk Field, Camp Douglas WI
The last fifteen miles
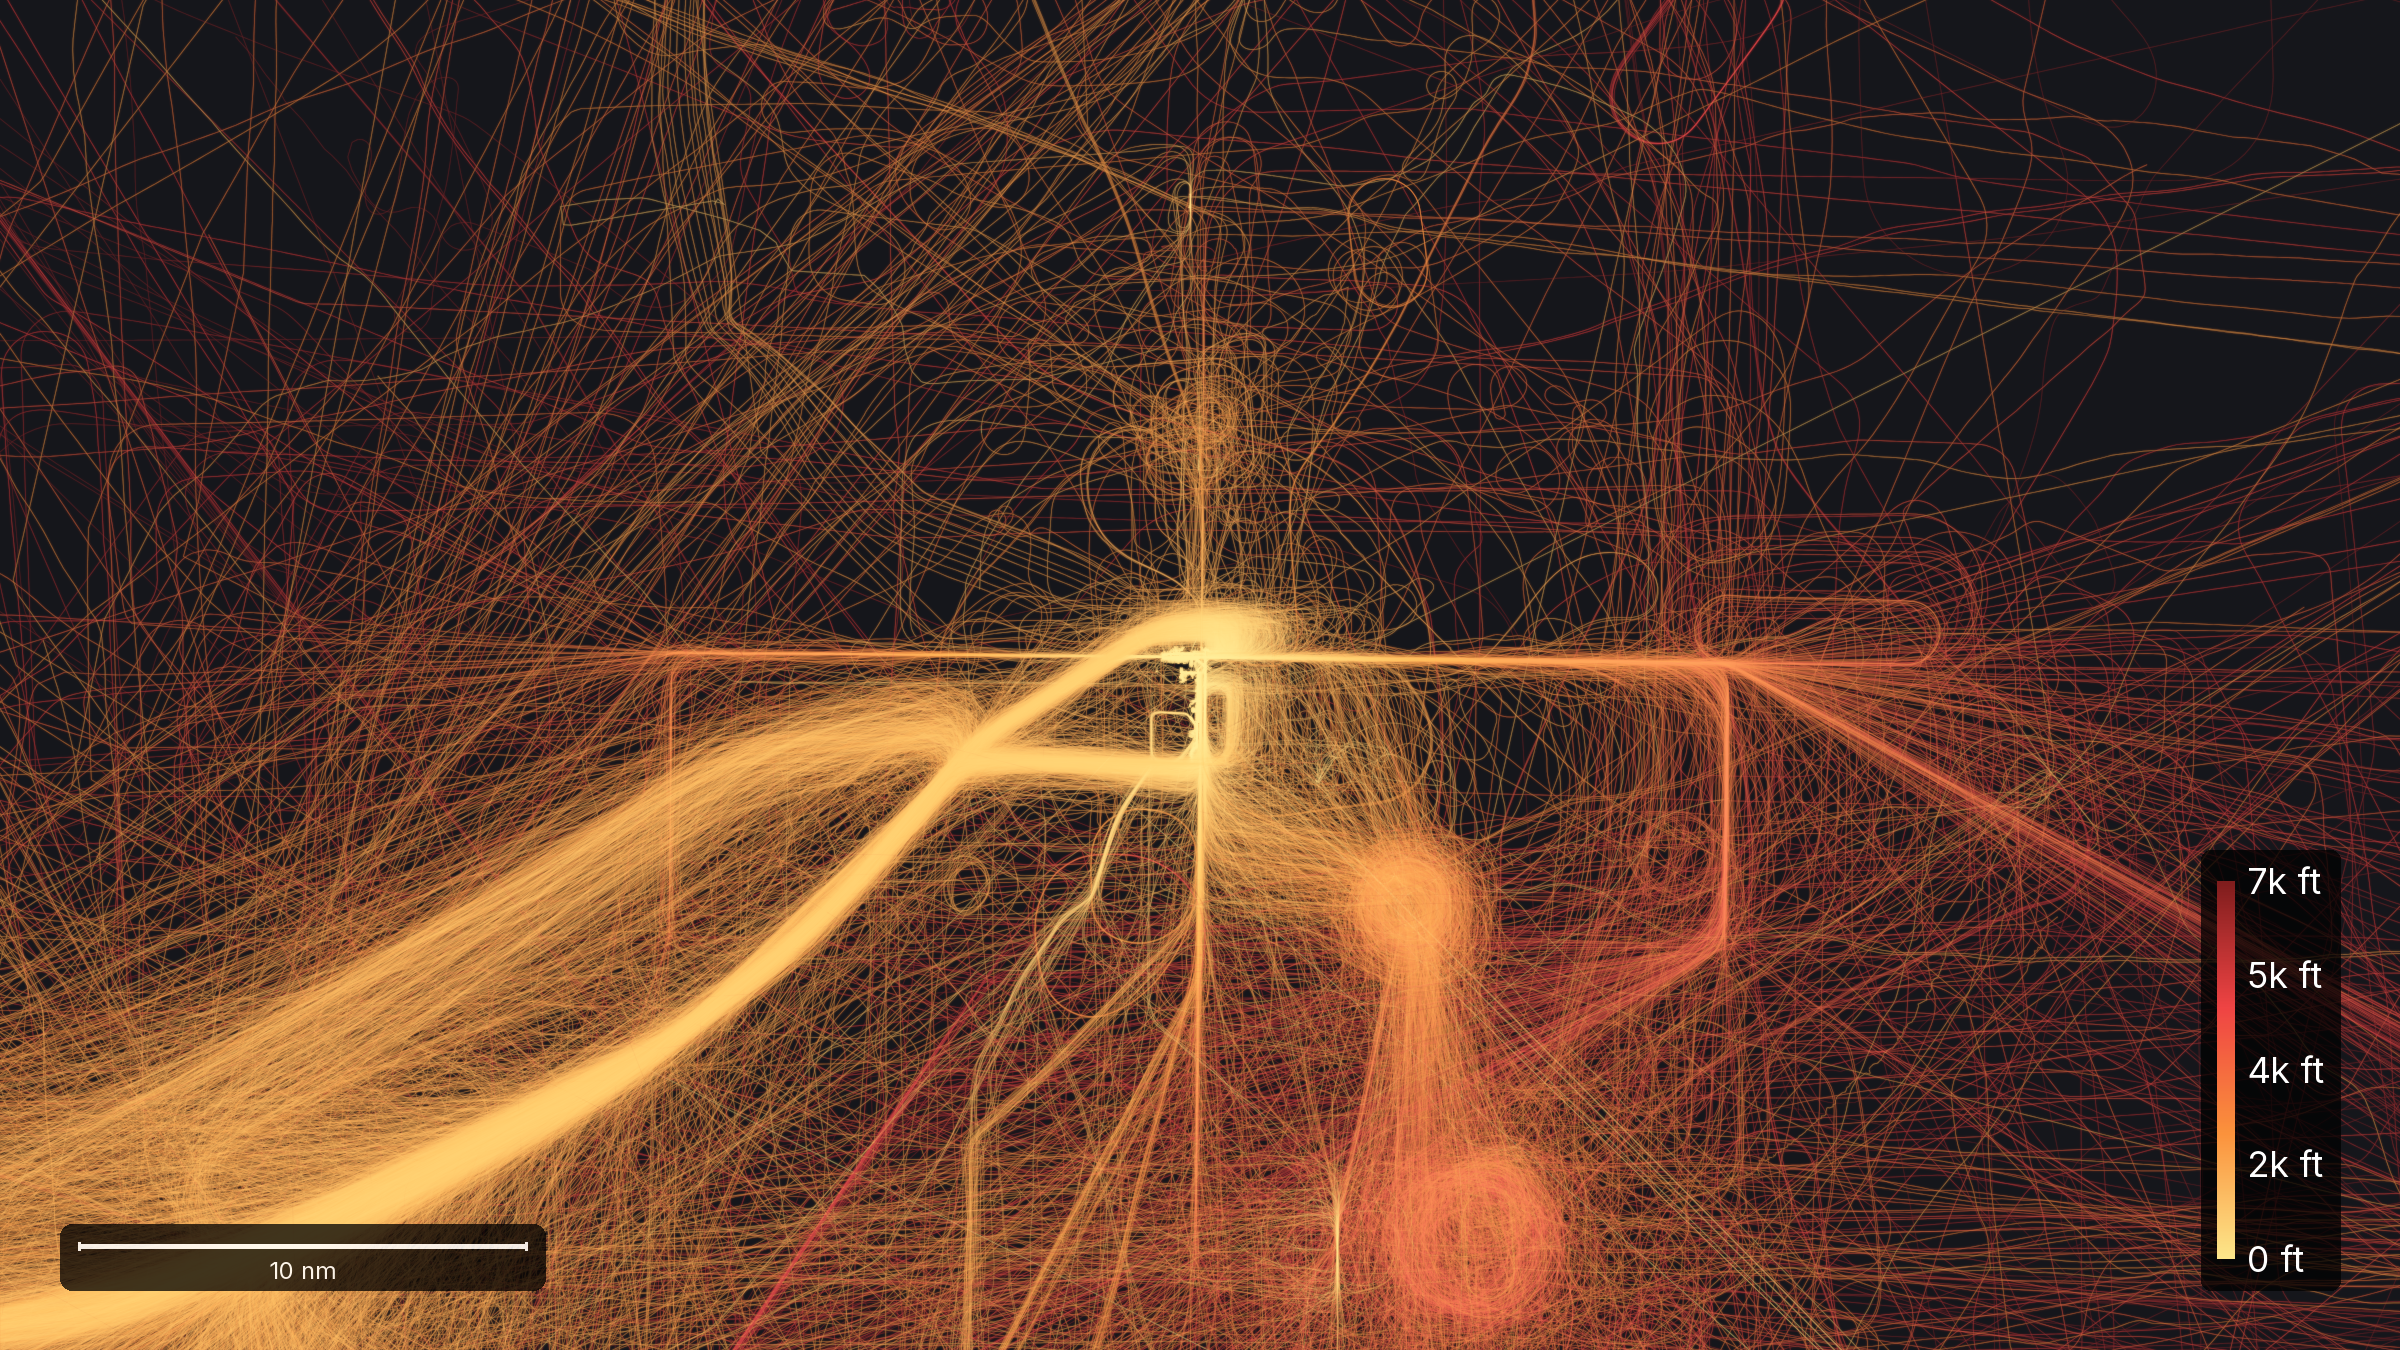
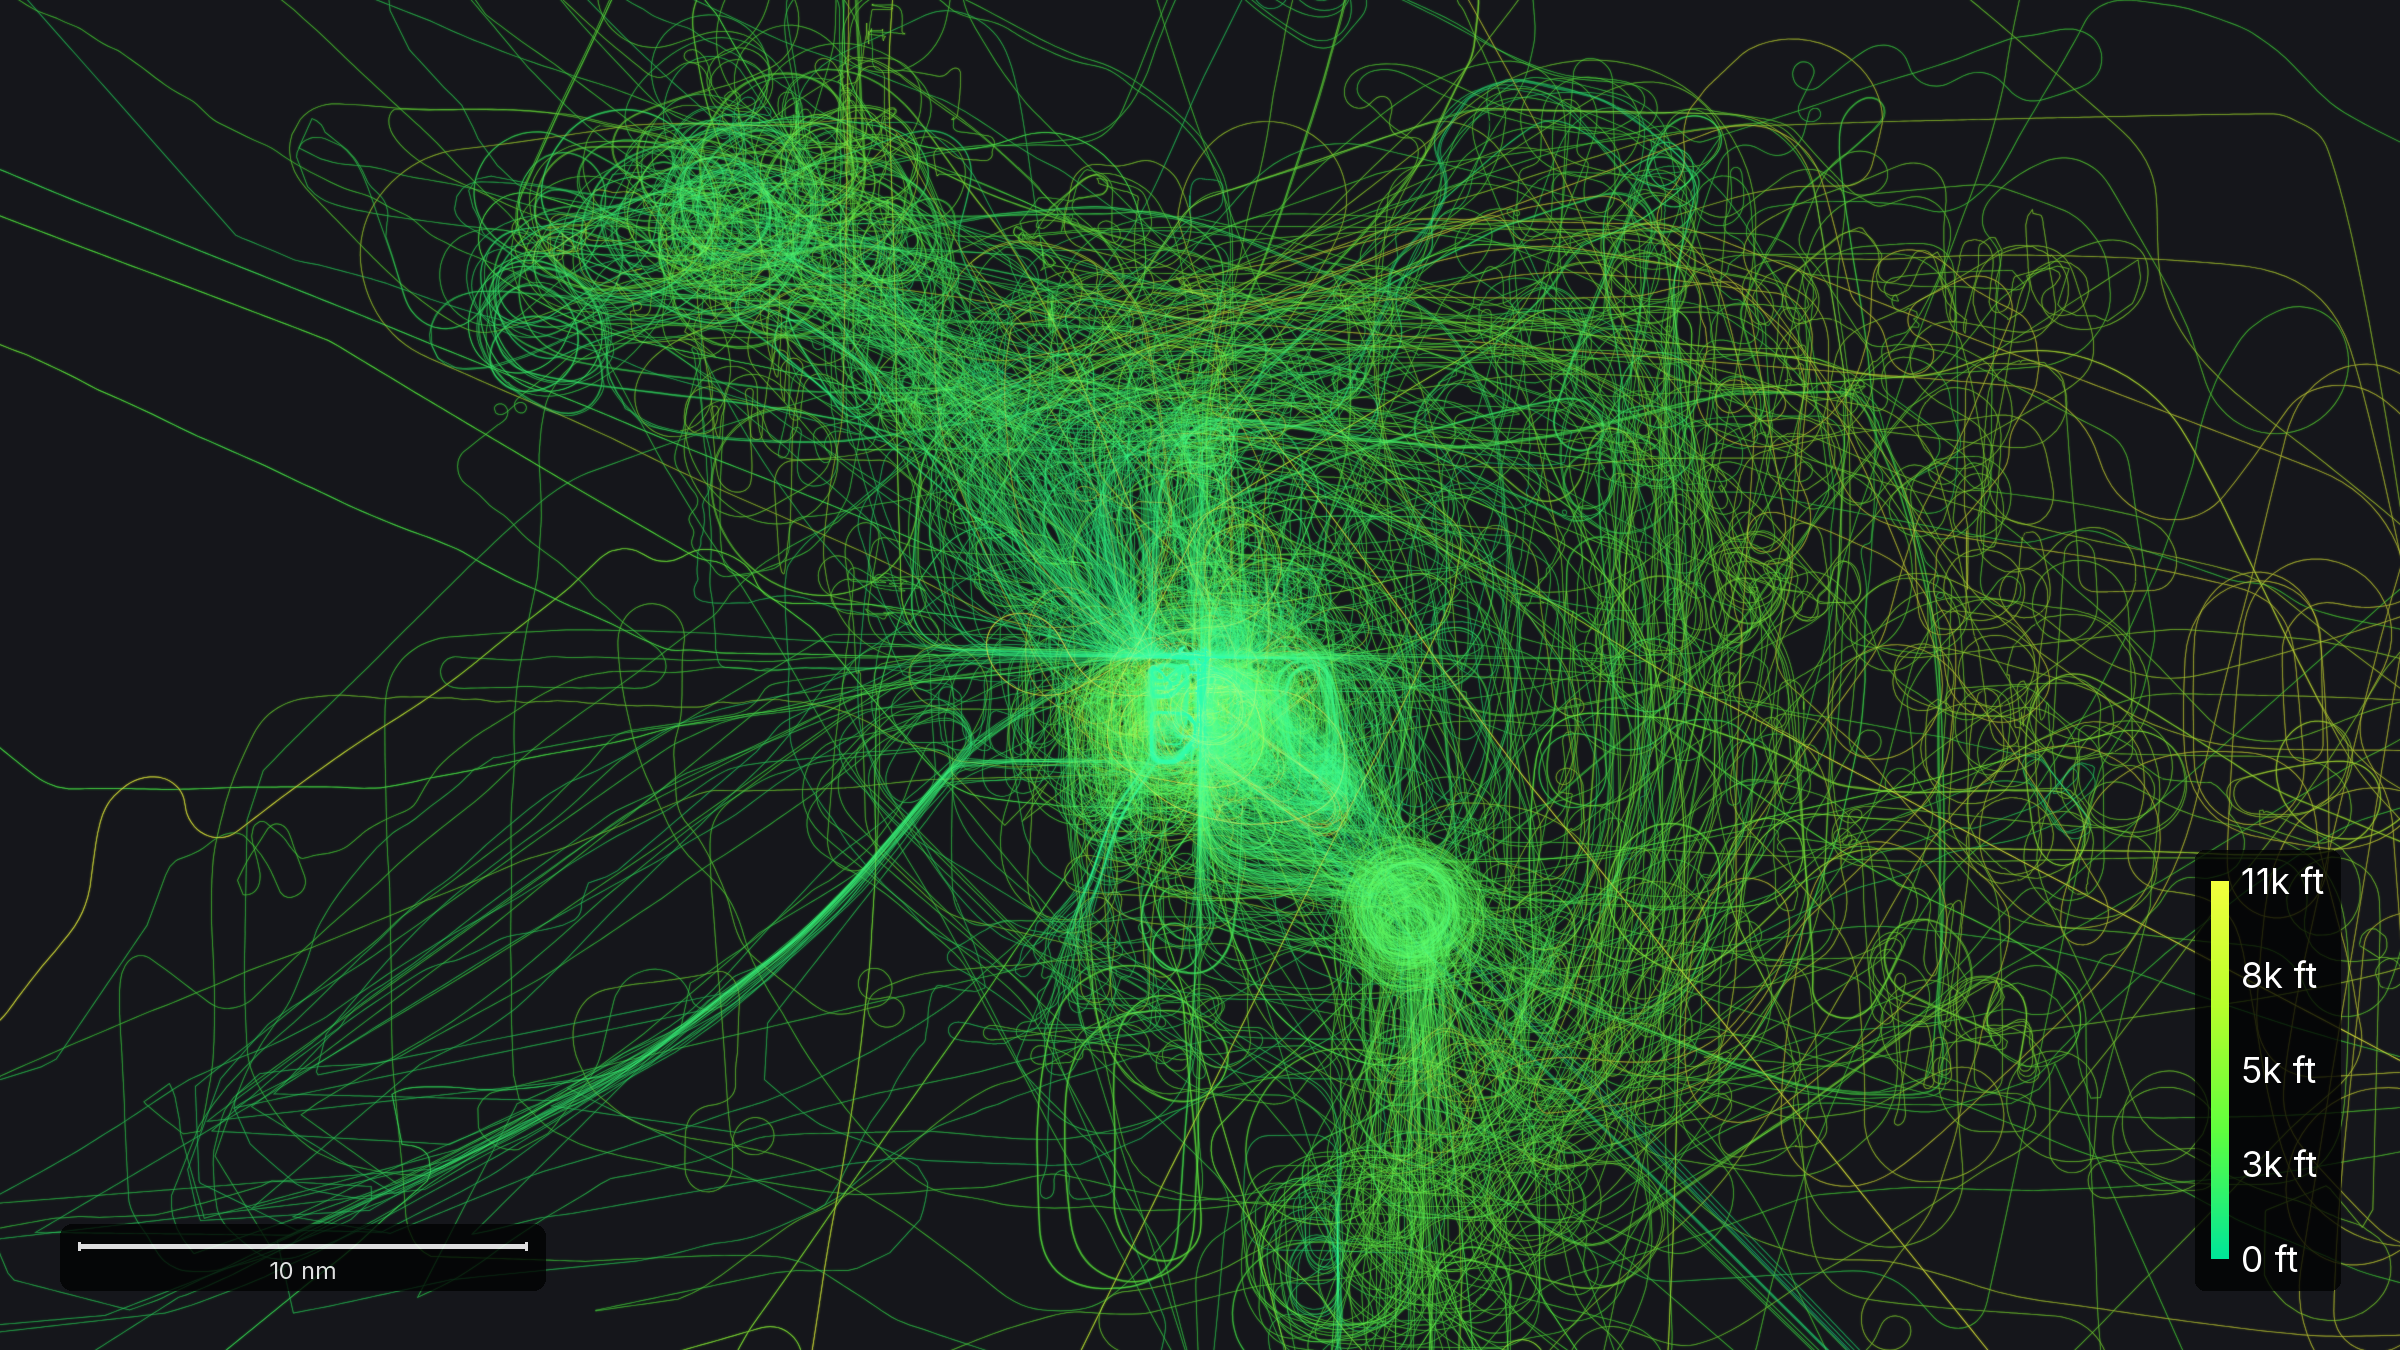
Not every flight came or went. 715 took off from Wittman and landed back on it: pattern work, demonstration flights, sightseeing loops, and the airshow's aerobatic box. These are the tracks the arrival and departure maps leave out.
Pistons, homebuilts, and jets
More than four in five flights never climbed past 10,000 feet. A smaller set flew high, into the airspace where the air is thin enough to be efficient.
Cessna led at 1,234 aircraft. The second-largest maker is not a company at all: 788 were homebuilt, aircraft assembled by an individual and registered under the builder's own name. That is the fly-in's signature, and it puts amateur builders ahead of every manufacturer except Cessna. Piper came next at 776, Beechcraft at 606. 174 makers brought at least one aircraft and 87 of them brought exactly one.
One caution on that table. Whether an amateur-built aircraft lands in the Homebuilt row or under a kit maker's name depends on what the builder wrote on the registration form. So 788 is a floor, and the 79 filed under Vans is not a count of Vans aircraft at the fly-in. The real number of amateur-built RVs is higher than either row shows.
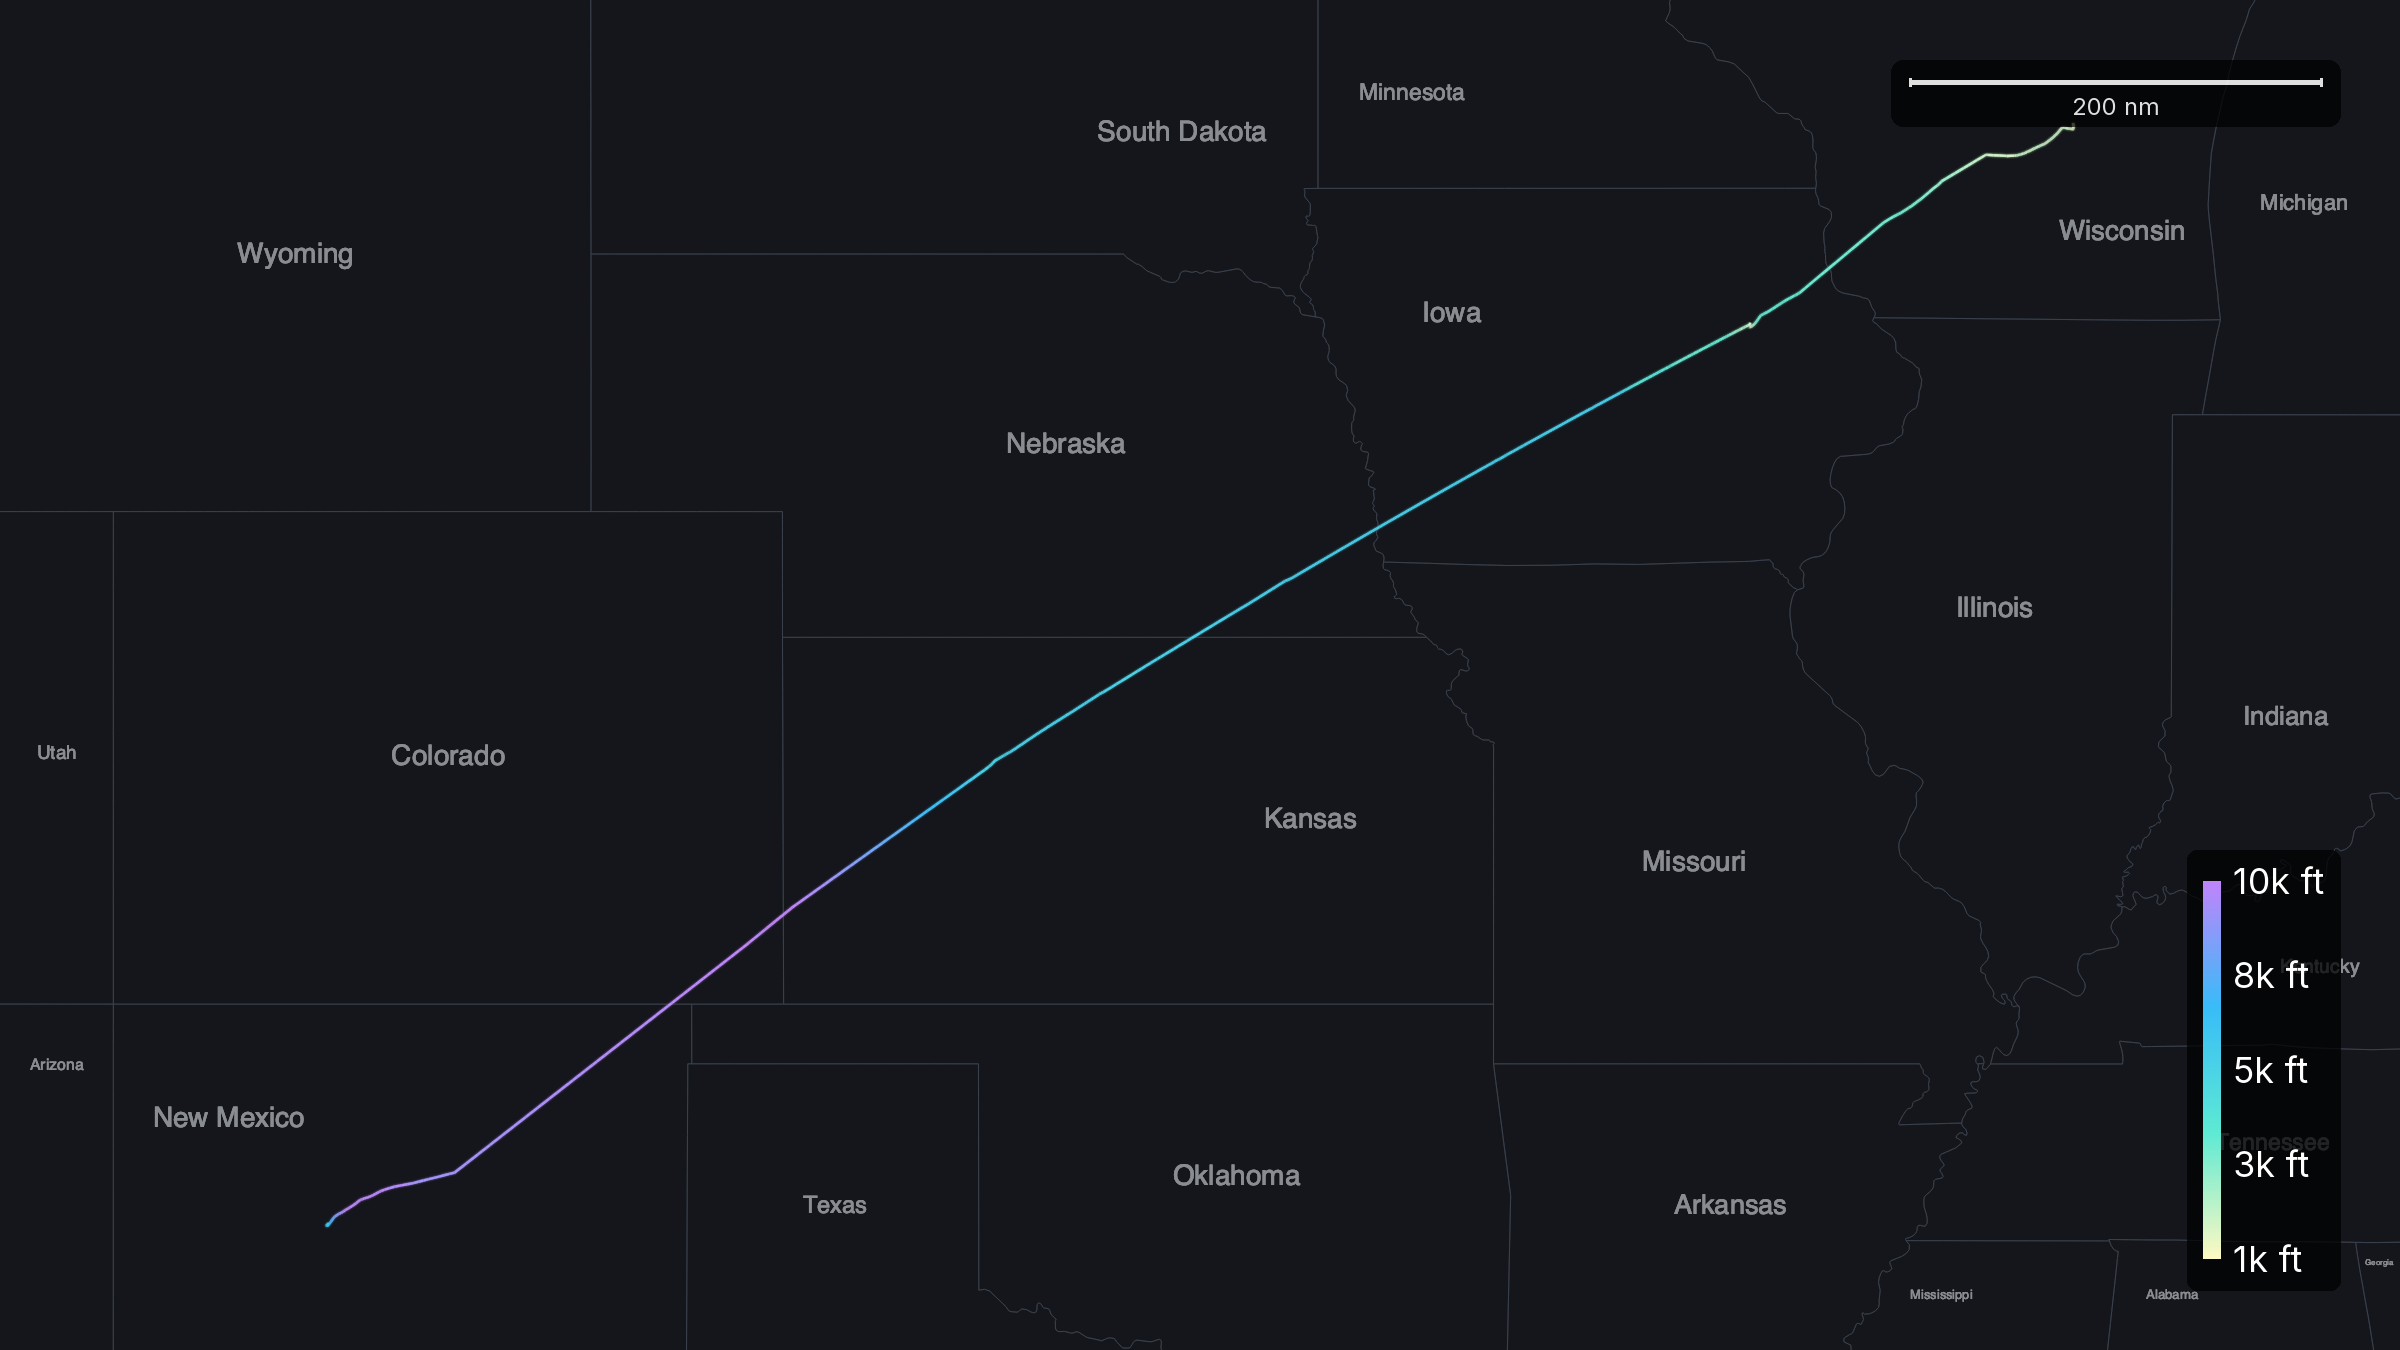
Six aircraft flew farther to get here than any other, and all six were turbine powered. The seventh was a Vans RV-7A, an amateur-built airplane that came 994 nautical miles from Albuquerque and never climbed above 9,875 feet.
- Distance
- about 994 nm
- Peak altitude
- 9,875 ft
- Type
- Amateur-built, single piston engine
Warbirds and antiques
The 2026 theme was Celebrating the Freedom of Flight, tied to the 250th anniversary of American independence. We tracked 172 military aircraft flying in or out.
- 1T-6, AT-6, SNJ and Harvard45
- 2T-28 Trojan16
- 3L-39 Albatros15
- 4T-34 Mentor12
- 5P-51 and F-51 Mustang12
- 6C-45 Expeditor and AT-11 Kansan10
- 7DHC-1 Chipmunk9
- 8B-25 Mitchell7
- 9PT-17 Stearman6
- 10BT-13 Valiant5
The remaining 18 came one of a kind: a B-17G, a P-38 Lightning, a P-47 Thunderbolt, a P-63 Kingcobra, an F8F Bearcat, an SBD Dauntless, a C-47, an HU-16 Albatross, a T-33, an L-19 Bird Dog, an L-5 Sentinel, and seven others.
Trainers dominate that list, as they do at every warbird gathering. The reason is not production numbers, since more BT-13s were built than T-28s and the T-28s outnumber them here. It is what survived, what was worth restoring, and what a private owner can afford to keep in the air.
The America 250 framing also does not entirely survive contact with the list. The third and seventh largest groups are a Czechoslovak jet trainer and a Canadian design mostly built in Britain. Counting the L-39s, Chipmunks, Yaks, Nanchang CJ-6s and SF.260s, 35 of the 172 are types that never served the United States.
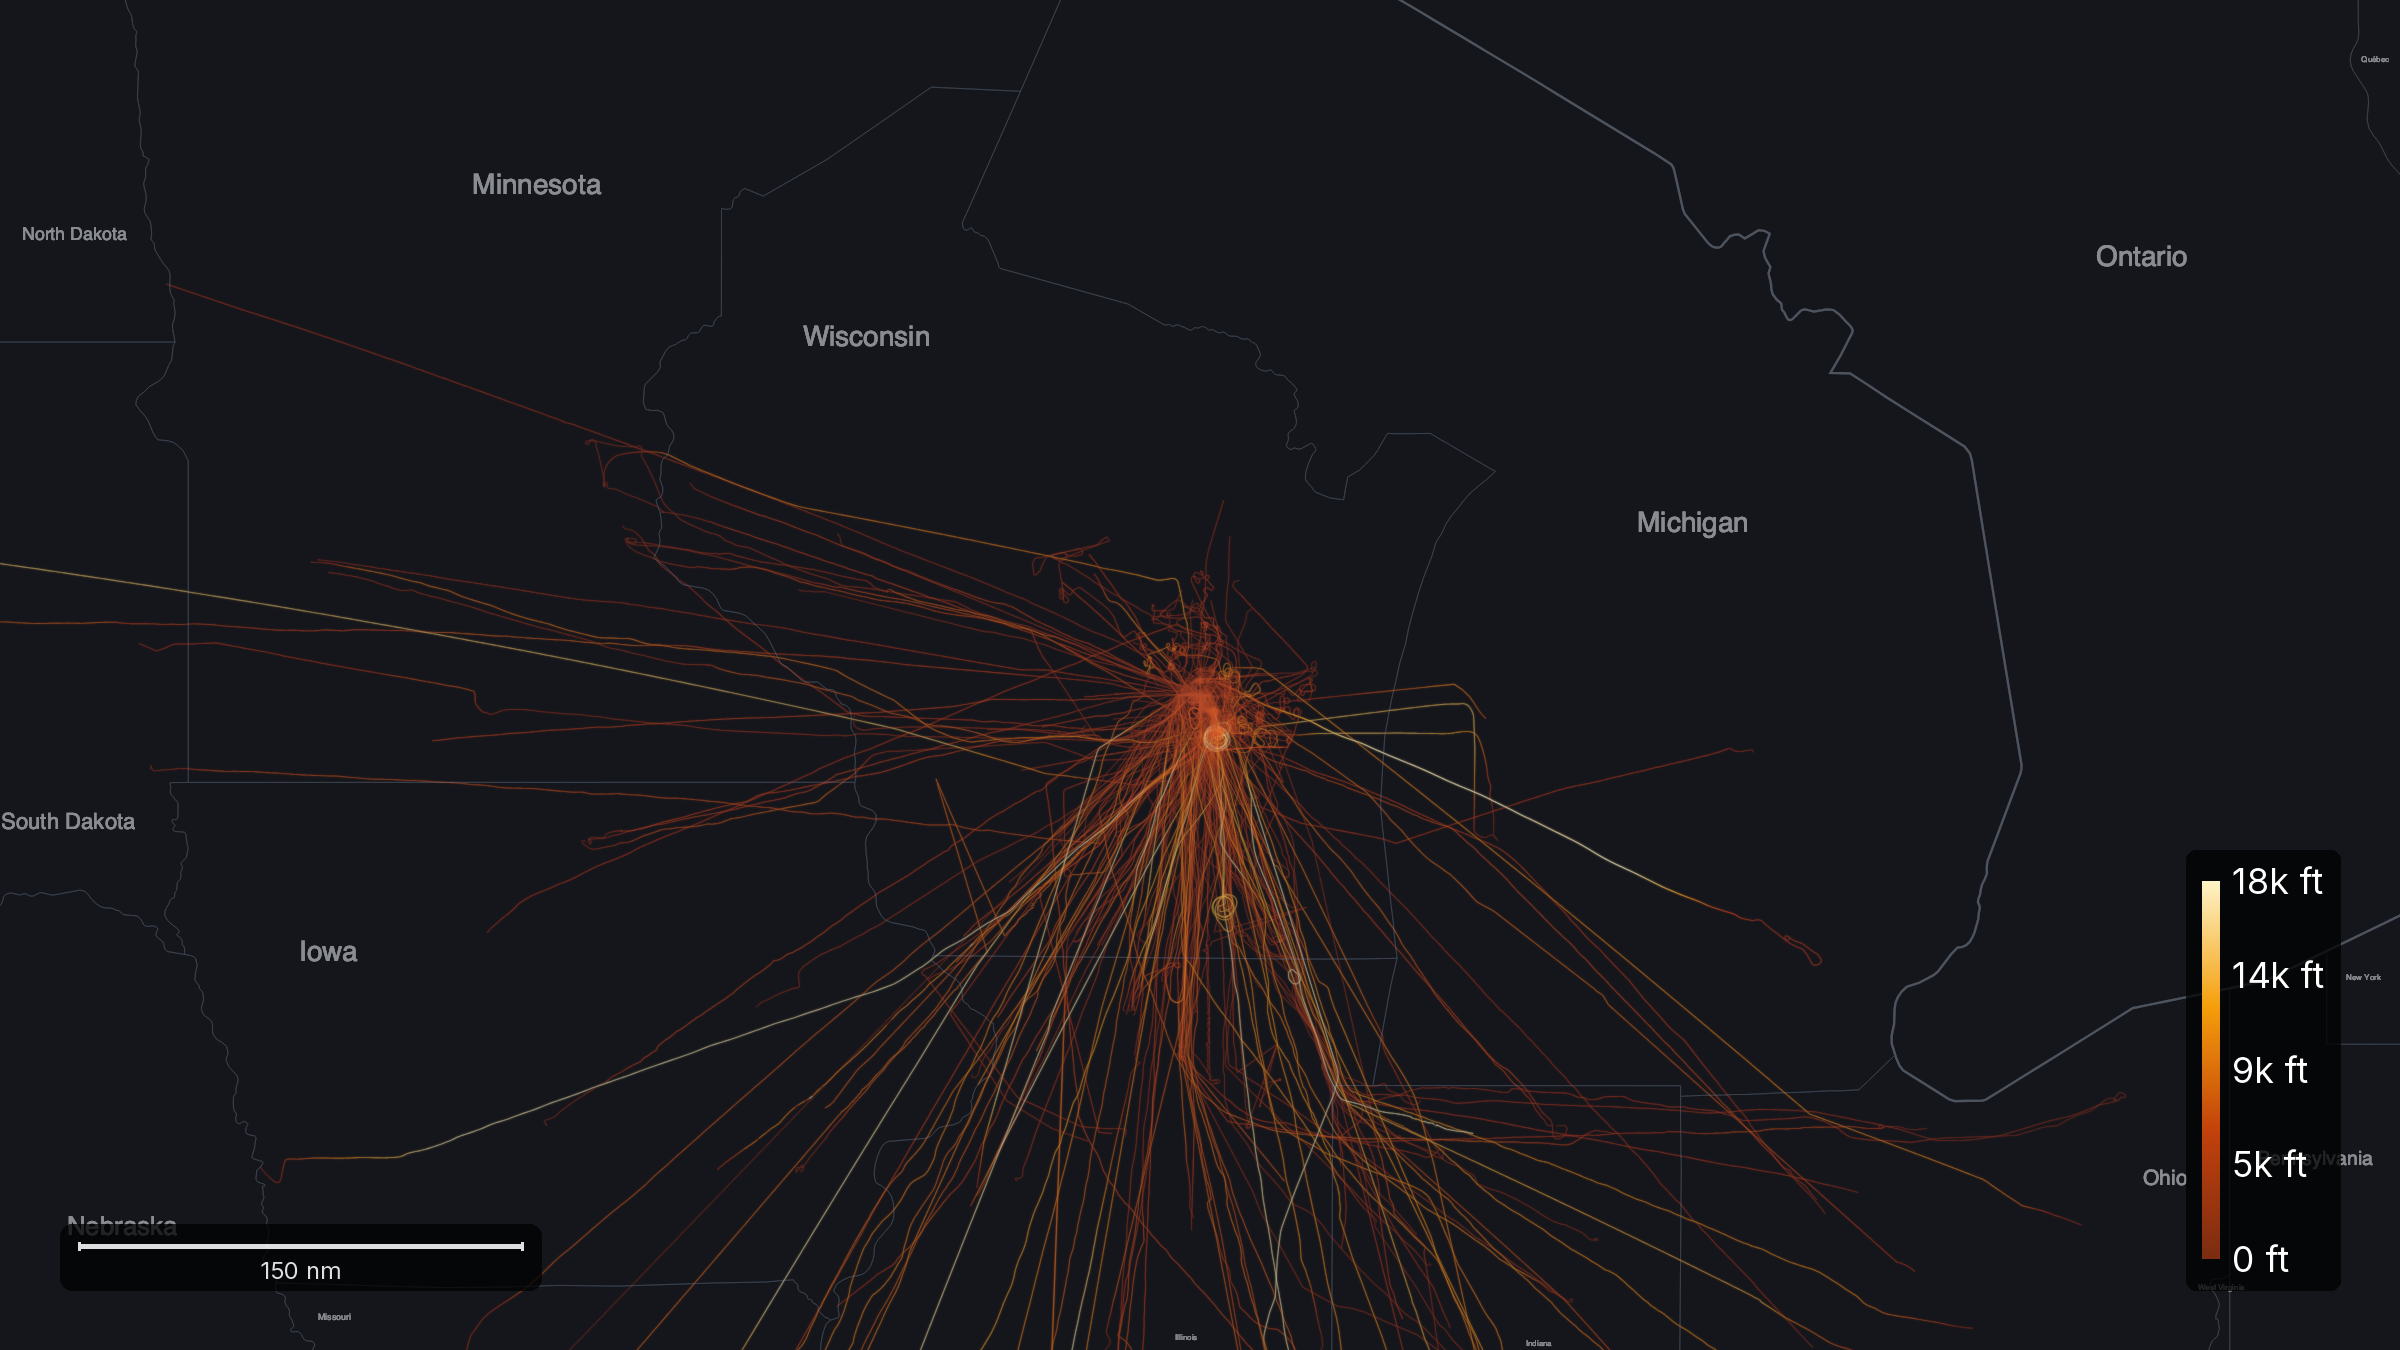
Set that against the count from the ground. EAA registered 360 warbirds among the 2,851 showplanes on the field. We tracked 172. The two numbers count different things: EAA counts aircraft parked and registered for display, we count aircraft that flew a tracked leg in or out between July 15 and 27. Part of the remainder is our own matching. The registry spells one aircraft a dozen ways, so whole families go missing until someone notices. Auditing this list against the fleet on the field added twelve aircraft the first pass had dropped.
On the civil side, the old fleet is larger than the warbird fleet. 338 of the aircraft we tracked were built before 1956 and 48 of them before 1946. Those years are close to the eras EAA's Vintage Aircraft Association judges by, which split at the end of August 1945 and the end of 1955; we bucket by calendar year, so the boundaries are near theirs rather than identical. Widening to the full Contemporary range, through 1970, brings the total to 1,439.
That older fleet is also the one this data sees worst. An aircraft flying into Oshkosh is not required to broadcast a position at all. The mandate covers busy airspace, and Wittman is a small tower-controlled field outside it. On top of that, aircraft originally certificated without an engine-driven electrical system are exempt from the requirement across most of the airspace it covers, which describes a great many antiques. The airplanes least likely to appear in this data are the ones the anniversary was about. Every count here is a floor.
Then there is how they fly. Among the three groups, the warbirds have the highest median cruise at 162 knots, against 142 for the modern fleet and 126 for the pre-1971 civil aircraft. That is a statement about groups and not about airplanes. The modern bucket runs from a 172 to a Gulfstream and describes neither, and the warbird figure is carried by advanced trainers rather than by fighters: 45 Texans against 12 Mustangs. A P-51 cruises around 240 knots, well clear of any of these medians, which is the more useful comparison. Both older groups did peak lower than the modern fleet.
Reading a week of tracks
A week of tracks read together shows things a day of them cannot: the three-day flood of arrivals, the two departure waves, the daily pulse of mornings out and afternoons closed, and twenty-seven Beechcraft crossing the fence half a minute apart. That shape is the fingerprint of the fly-in, and shapes like it are the raw material behind the prints we make.
The 2025 fly-in has the same skeleton: see the 2025 AirVenture week in ADS-B. Other events leave their own mark on the sky. After a championship, the private jets drain out of a city in one night: see the private-jet exodus after Super Bowl LX.
How the counting works
Our 9,803 and the FAA's 15,527 are not the same measurement, and the FAA's is the larger for several reasons. It counts every takeoff and landing, so a single local flight doing circuits contributes many operations while we count it as none. It covers a window two days shorter than ours. And it counts every aircraft the tower worked, while we can only count aircraft broadcasting a position that our data source received. That last gap is the largest and we cannot size it precisely, which is why every figure in this article is a floor rather than a total.
Sources
Flight tracks: our own ADS-B render of every arrival and departure we could track cleanly at Oshkosh (KOSH) from July 15 to 27, 2026, via PlaneQuery. Attendance, the showplane and warbird registration counts, the theme, and the 15,527 operations figure: EAA and the FAA. The published arrival altitudes and the Ripon to Fisk routing: the FAA's AirVenture notice. Mass arrival timings: EAA and Bonanzas to Oshkosh. Aircraft types, makers, and years of manufacture: the FAA aircraft registry, which carries no year for about a third of United States registrations. For what the underlying signal is, see what ADS-B actually is.