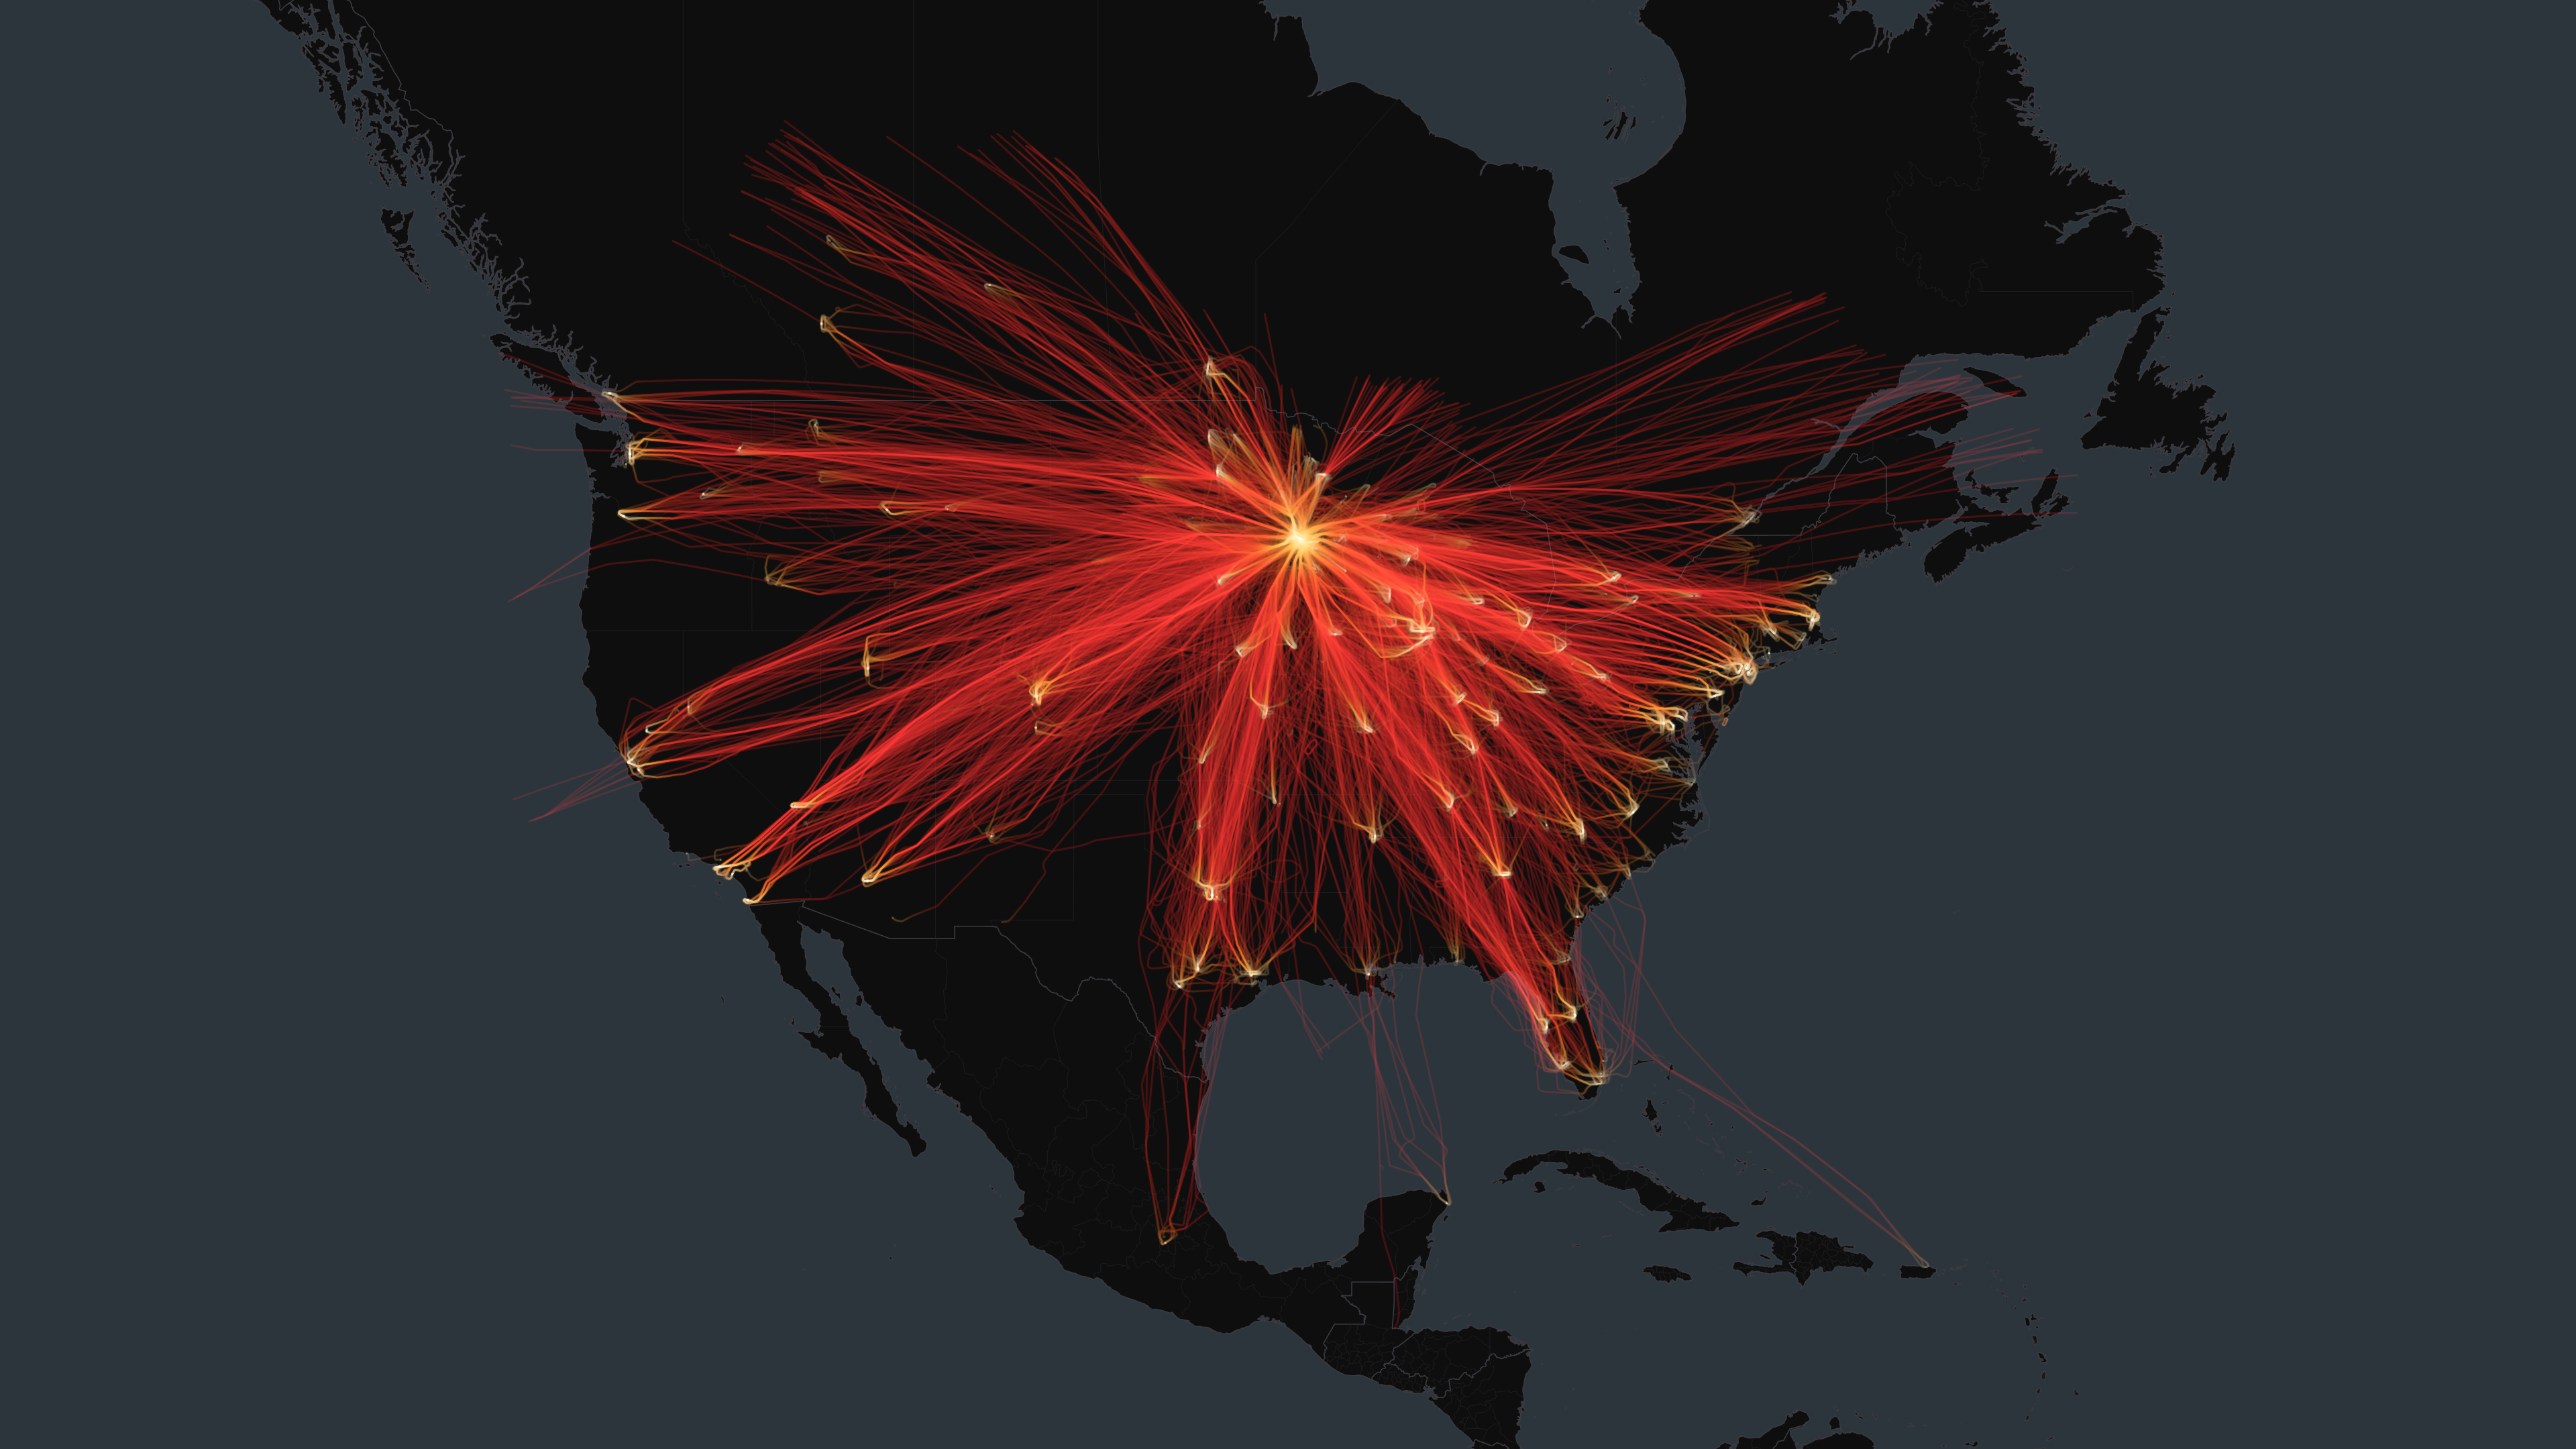
MSPKMSP
July 5, 2025 – July 10, 20256 days6,014 flights4,803,027 ADS-B points
Get this printAbout the data
Flights reconstructed from ADS-B, the position signal modern aircraft broadcast to air traffic. Coverage is strongest across North America and Europe, thinner over oceans, polar regions, and parts of Asia and Africa.
Long-haul flights whose paths cross sparsely-covered areas may appear with an unknown origin or destination, because the receiver network loses sight of them mid-ocean. We mark those unknown rather than guess. Every flight is still counted in the totals; the route-by-route breakdown filters to flights with identified endpoints.

Loading flights…
Summary
Total Flights
6,014
Arrivals
3,007
Departures
3,007
Unique Aircraft
1,156
Peak Day Flights
1,089
Avg / Day
1,002
Notable Flights
Shortest
3 NM5 min
From MSP — Minneapolis–Saint Paul International Airport / Wold–Chamberlain Field
N576DN
Longest
2352 NM316 min
From SJU — Luis Munoz Marin
N878DN
Highest
49,175 ft1398 NM
To FXE — Fort Lauderdale Executive
N905VR
Most Active
Day Highlights
Each day in CDT time
Busiest Day
Jul 10, 2025
1089 flights · 550 arr / 539 dep
Quietest Day
Jul 5, 2025
834 flights · 413 arr / 421 dep
Avg Daily Flights
1,002
across 6 days
| Date | Flights |
|---|---|
| Sat 7/5 | 834 |
| Sun 7/6 | 1042 |
| Mon 7/7 | 1065 |
| Tue 7/8 | 972 |
| Wed 7/9 | 1012 |
| Thu 7/10 | 1089 |
Performance
Max Altitude
49,175ft
Avg Altitude
17,627ft
Max Groundspeed
600kts
Avg Groundspeed
292kts
Total Distance
4,260,139NM
Avg Leg Distance
708NM
Avg Leg Duration
117min
Traffic Flow
Arrivals
Departures
Flight Trails
Routes
Arriving from
ORD
Chicago O'Hare International Airport107
DEN
Denver International Airport101
ATL
Hartsfield Jackson Atlanta International Airport60
LAX
Los Angeles International Airport56
DFW
Dallas Fort Worth International Airport55
LAS
Harry Reid International Airport54
PHX
Phoenix Sky Harbor International Airport52
MDW
Chicago Midway International Airport51
SEA
Seattle–Tacoma International Airport49
DTW
Detroit Metropolitan Wayne County Airport45
BOS
General Edward Lawrence Logan International Airport44
CLT
Charlotte Douglas International Airport41
SFO
San Francisco International Airport41
STL
St. Louis Lambert International Airport39
MCO
Orlando International Airport39
LGA
LaGuardia Airport38
CVG
Cincinnati Northern Kentucky International Airport37
PHL
Philadelphia International Airport37
BNA
Nashville International Airport37
IAH
George Bush Intercontinental Airport37
Aircraft by Registration Country
United States1110
Canada28
France5
Croatia3
Slovenia3
Germany2
Netherlands1
Qatar1
Australia1
South Korea1
Aircraft
1156 unique aircraft
N292PQ
40 flights
N679CA
38 flights
N250SY
34 flights
N308SY
34 flights
N305SY
32 flights
N549CA
32 flights
N710EV
31 flights
N296SY
30 flights
N709EV
30 flights
N255SY
29 flights
N307PQ
29 flights
N718EV
28 flights
N832HK
28 flights
N607LR
27 flights
N125DU
26 flights
N325US
26 flights
N153PQ
26 flights
N899AT
26 flights
N181GJ
26 flights
N297PQ
25 flights
Every flight path above, on a museum-quality aluminum print.