TPERCTP
September 6, 2025 – September 27, 202522 days11,744 flights3,232,392 ADS-B points

Get this print
About the data
Flights reconstructed from ADS-B, the position signal modern aircraft broadcast to air traffic. Coverage is strongest across North America and Europe, thinner over oceans, polar regions, and parts of Asia and Africa.
The print is a curated selection. To draw the clearest image, I keep the flights with a clean arrival or departure at the airport and set the rest aside; on a busy airport, that can be most of the raw ADS-B. Every stat, route, and total on this page counts only those kept flights.
A few of those kept flights are long-haul, crossing sparsely-covered airspace where the receiver network loses sight of them mid-ocean. That leaves an origin or destination unknown, which I mark rather than guess. They still count in the totals above, but the route-by-route breakdown lists only flights with both endpoints identified.
About Taiwan Taoyuan International Airport
The sky over Taiwan Taoyuan International Airport
The arrivals and departures behind the print, colored by altitude.
Loading flights…
Summary
Total flights
11,744
Arrivals
5,045
Departures
6,699
Unique aircraft
1,337
Peak day flights
705
Avg / day
534
Notable flights
Shortest
19 NM11 min
To TSA — Taipei Songshan
B-18358
Longest
2018 NM271 min
B-18915
Highest
45,950 ft283 NM
B-18912
Most seen aircraft
73flights
B-18108
Day highlights
Each day in CST time
Busiest day
Sep 18, 2025
705 flights · 349 arr / 356 dep
Quietest day
Sep 15, 2025
306 flights · 14 arr / 292 dep
Avg daily flights
534
across 22 days
| Date | Flights |
|---|---|
| Sat 9/6 | 425 |
| Sun 9/7 | 432 |
| Mon 9/8 | 446 |
| Tue 9/9 | 478 |
| Wed 9/10 | 410 |
| Thu 9/11 | 334 |
| Fri 9/12 | 426 |
| Sat 9/13 | 453 |
| Sun 9/14 | 469 |
| Mon 9/15 | 306 |
| Tue 9/16 | 627 |
| Wed 9/17 | 650 |
| Thu 9/18 | 705 |
| Fri 9/19 | 678 |
| Sat 9/20 | 658 |
| Sun 9/21 | 645 |
| Mon 9/22 | 594 |
| Tue 9/23 | 435 |
| Wed 9/24 | 564 |
| Thu 9/25 | 650 |
| Fri 9/26 | 690 |
| Sat 9/27 | 669 |
Performance
Max altitude
45,950ft
Avg altitude
10,544ft
Max groundspeed
602kts
Avg groundspeed
246kts
Total distance
3,532,651NM
Avg leg distance
301NM
Avg leg duration
52min
Traffic flow
Arrivals
Departures
Flight trails
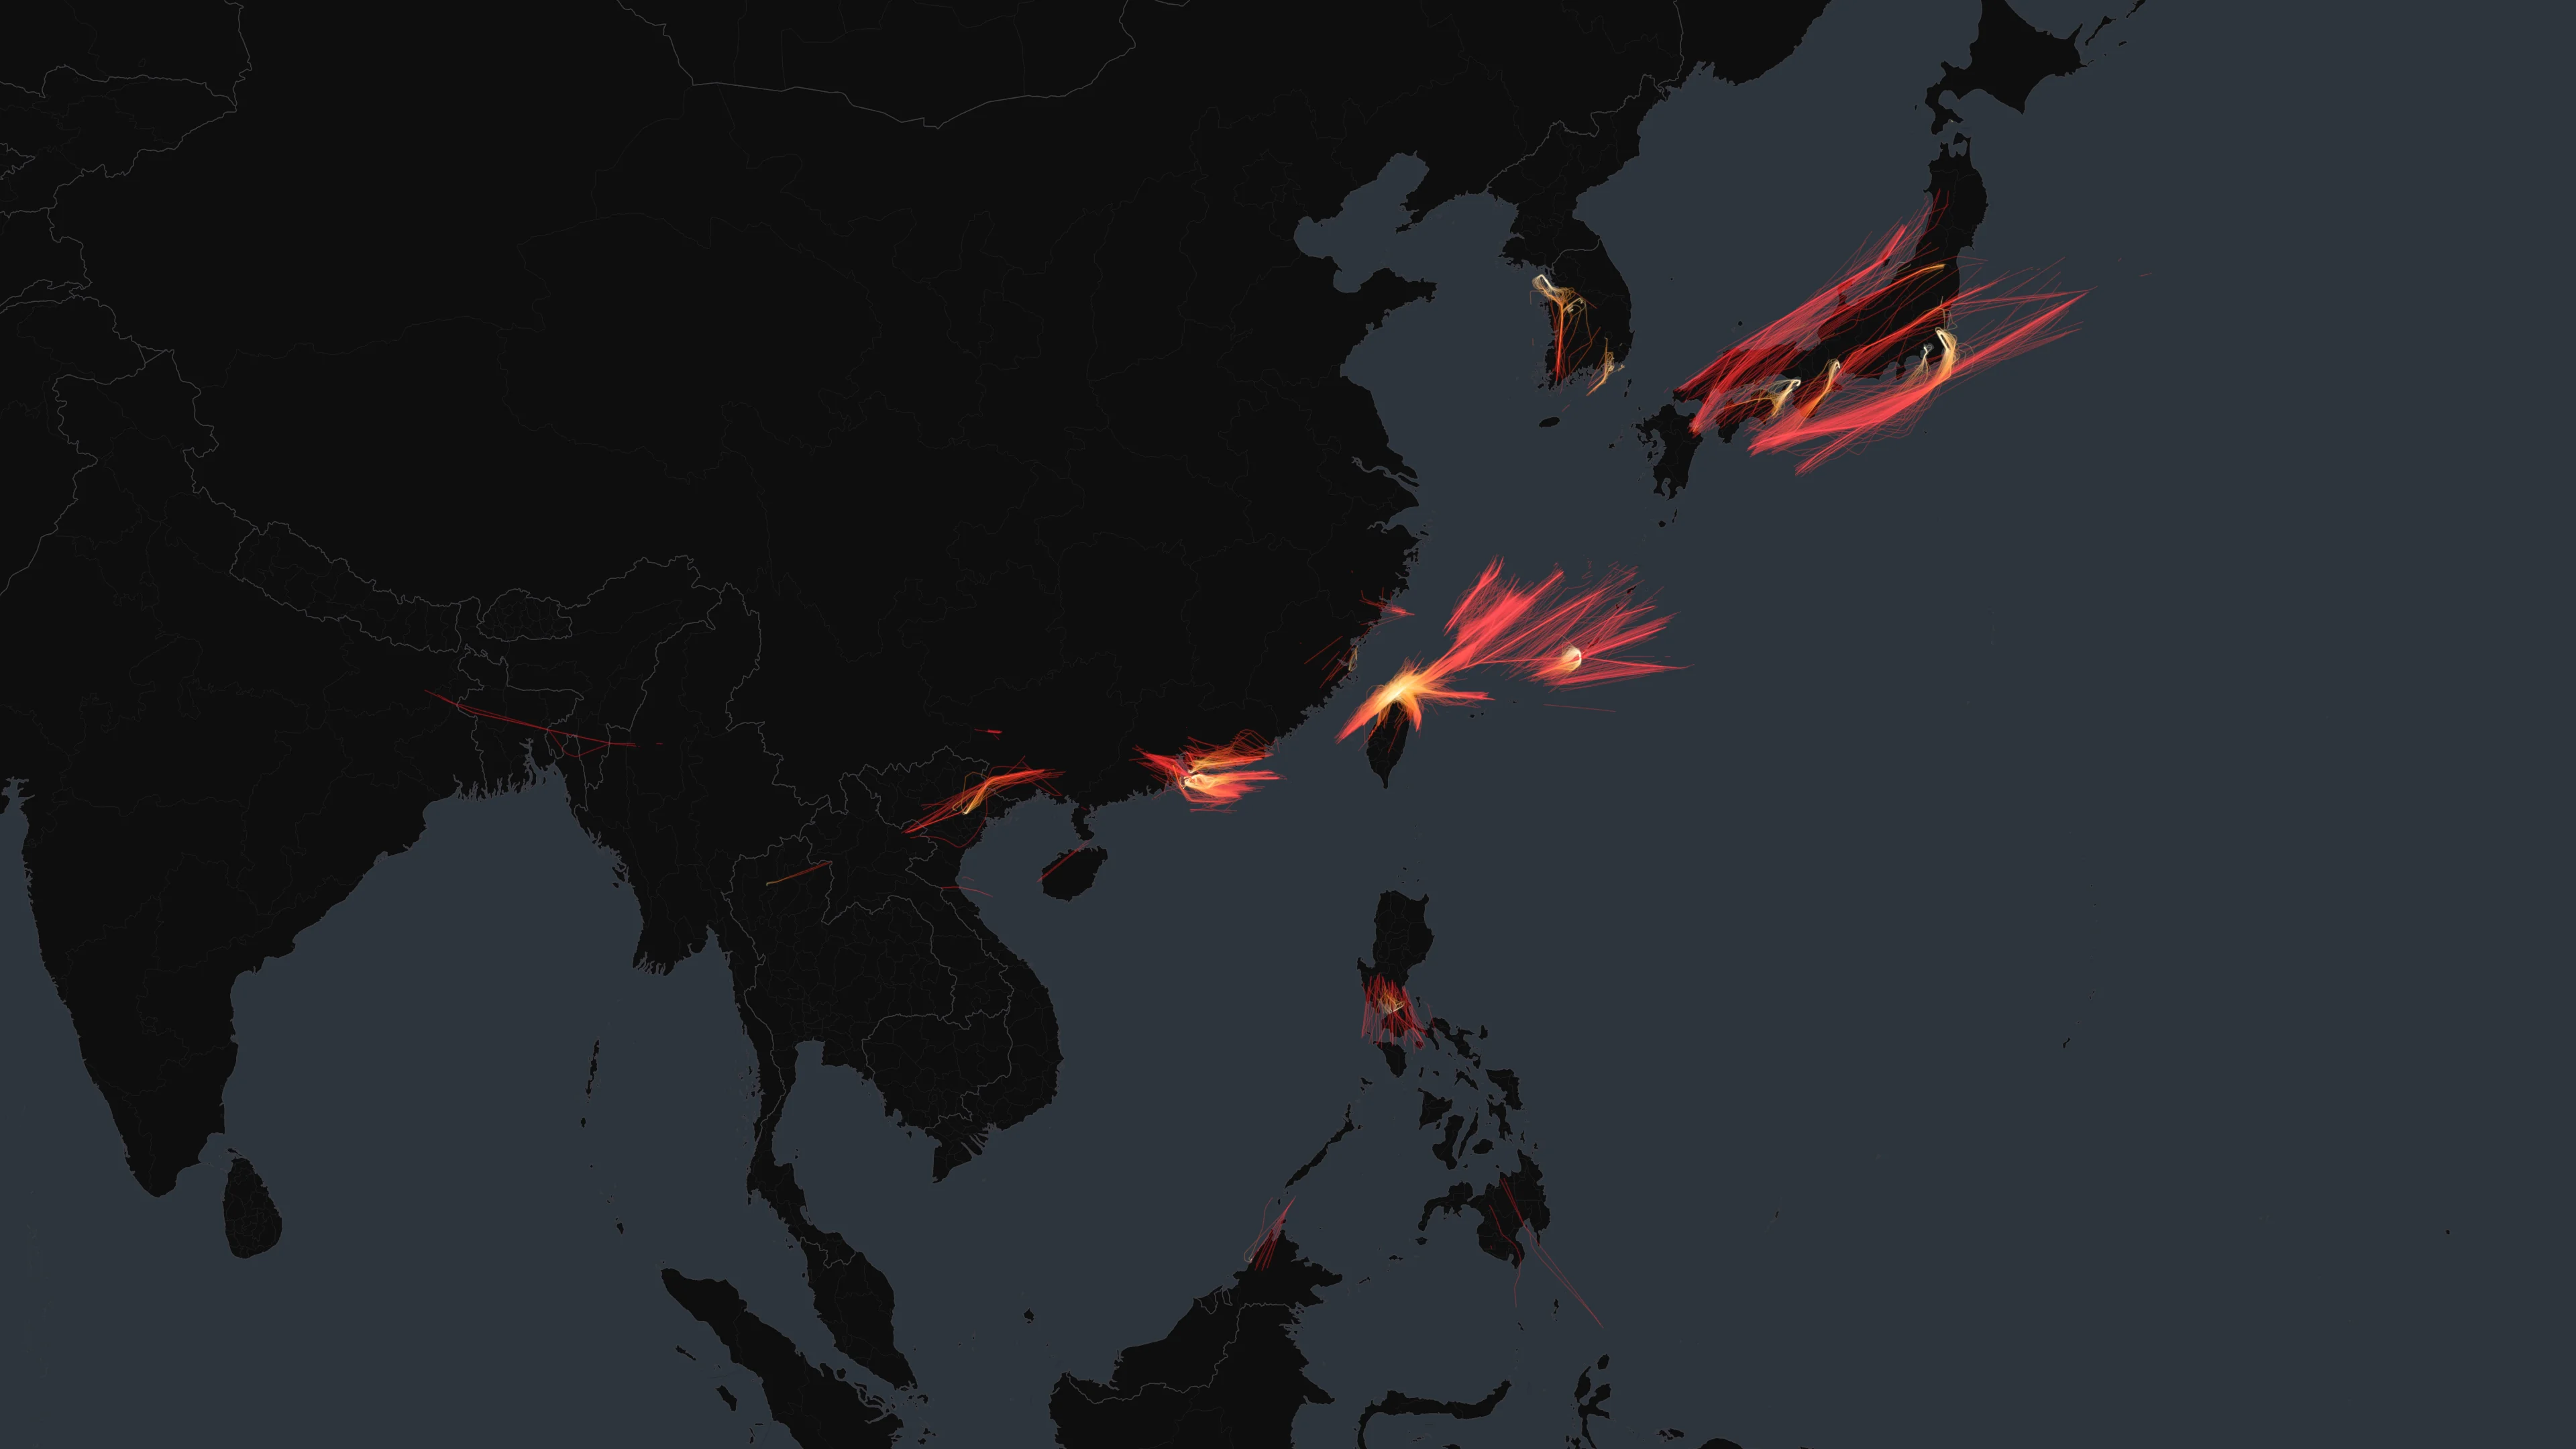
Routes
Arriving from
HKG
Hong Kong International Airport331
OKA
Naha International Airport167
CYI
Chiayi Airport50
RMQ
Taichung International Airport / Ching Chuang Kang Air Base43
TSA
Taipei Songshan International Airport35
HAN
Noi Bai International Airport31
SZX
Shenzhen Bao'an International Airport21
HSZ
Hsinchu Air Base21
MNL
Ninoy Aquino International Airport12
FOC
Fuzhou Changle International Airport4
PUS
Gimhae International Airport4
FUO
Foshan Shadi Airport4
MFM
Macau International Airport3
SGL
Danilo Atienza Air Base3
ICN
Incheon International Airport2
TRA
Tarama Airport2
HHP
Shun Tak Heliport2
CNX
Chiang Mai International Airport2
BKI
Kota Kinabalu International Airport2
TKN
Tokunoshima Airport2
Departing to
MFM
Macau International Airport370
NRT
Narita International Airport212
OKA
Naha International Airport205
HKG
Hong Kong International Airport153
KIX
Kansai International Airport116
RMQ
Taichung International Airport / Ching Chuang Kang Air Base90
HUN
Hualien Chiashan Airport74
ICN
Incheon International Airport56
NGO
Chubu Centrair International Airport48
WNZ
Wenzhou Longwan International Airport37
CYI
Chiayi Airport36
TSA
Taipei Songshan International Airport28
HND
Tokyo Haneda International Airport24
CJJ
Cheongju International Airport/Cheongju Air Base (K-59/G-513)18
MZG
Penghu Magong Airport17
SZX
Shenzhen Bao'an International Airport13
MNL
Ninoy Aquino International Airport7
HSZ
Hsinchu Air Base5
UKB
Kobe Airport5
HKD
Hakodate Airport5
Aircraft by registration country
China388
Taiwan204
United States139
South Korea137
Japan85
Thailand82
Vietnam67
Philippines49
Malaysia41
United Arab Emirates40
Aircraft
1337 unique aircraft
B-18108
73 flights
B-18110
72 flights
B-18807
72 flights
B-18109
71 flights
B-18203
70 flights
B-18105
70 flights
B-18663
69 flights
B-50001
68 flights
B-18107
68 flights
B-16221
67 flights
B-16336
66 flights
B-18311
66 flights
B18112
64 flights
B-18106
64 flights
B-50011
63 flights
B-16222
63 flights
B-18666
60 flights
B-50017
57 flights
B-58211
55 flights
B-16337
54 flights
The shape above is TPE's portrait, on museum-quality aluminum.