YVRCYVR
July 22, 2026 – August 8, 202618 days11,544 flights7,954,842 ADS-B points

Get this print
About the data
Flights reconstructed from ADS-B, the position signal modern aircraft broadcast to air traffic. Coverage is strongest across North America and Europe, thinner over oceans, polar regions, and parts of Asia and Africa.
The print is a curated selection. To draw the clearest image, I keep the flights with a clean arrival or departure at the airport and set the rest aside; on a busy airport, that can be most of the raw ADS-B. Every stat, route, and total on this page counts only those kept flights.
A few of those kept flights are long-haul, crossing sparsely-covered airspace where the receiver network loses sight of them mid-ocean. That leaves an origin or destination unknown, which I mark rather than guess. They still count in the totals above, but the route-by-route breakdown lists only flights with both endpoints identified.
About Vancouver International Airport
The sky over Vancouver International Airport
The arrivals and departures behind the print, colored by altitude.
Loading flights…
Summary
Total Flights
11,544
Arrivals
5,654
Departures
5,890
Unique Aircraft
1,602
Peak Day Flights
744
Avg / Day
641
Notable Flights
Shortest
11 NM18 min
From YDT — Boundary Bay
C-GGZZ
Longest
2717 NM398 min
To AZO — Kalamazoo/Battle Creek
N373RS
Highest
51,925 ft953 NM
To VNY — Van Nuys
N889KH
Most Seen Aircraft
101flights
C-GGND
Day Highlights
Each day in PDT time
Busiest Day
Jul 23, 2026
744 flights · 387 arr / 357 dep
Quietest Day
Aug 1, 2026
166 flights · 74 arr / 92 dep
Avg Daily Flights
641
across 18 days
| Date | Flights |
|---|---|
| Wed 7/22 | 636 |
| Thu 7/23 | 744 |
| Fri 7/24 | 683 |
| Sat 7/25 | 669 |
| Sun 7/26 | 679 |
| Mon 7/27 | 701 |
| Tue 7/28 | 697 |
| Wed 7/29 | 685 |
| Thu 7/30 | 743 |
| Fri 7/31 | 675 |
| Sat 8/1 | 166 |
| Sun 8/2 | 520 |
| Mon 8/3 | 657 |
| Tue 8/4 | 630 |
| Wed 8/5 | 684 |
| Thu 8/6 | 617 |
| Fri 8/7 | 731 |
| Sat 8/8 | 627 |
Performance
Max Altitude
51,925ft
Avg Altitude
18,296ft
Max Groundspeed
615kts
Avg Groundspeed
294kts
Total Distance
8,059,039NM
Avg Leg Distance
698NM
Avg Leg Duration
116min
Traffic Flow
Arrivals
Departures
Flight Trails
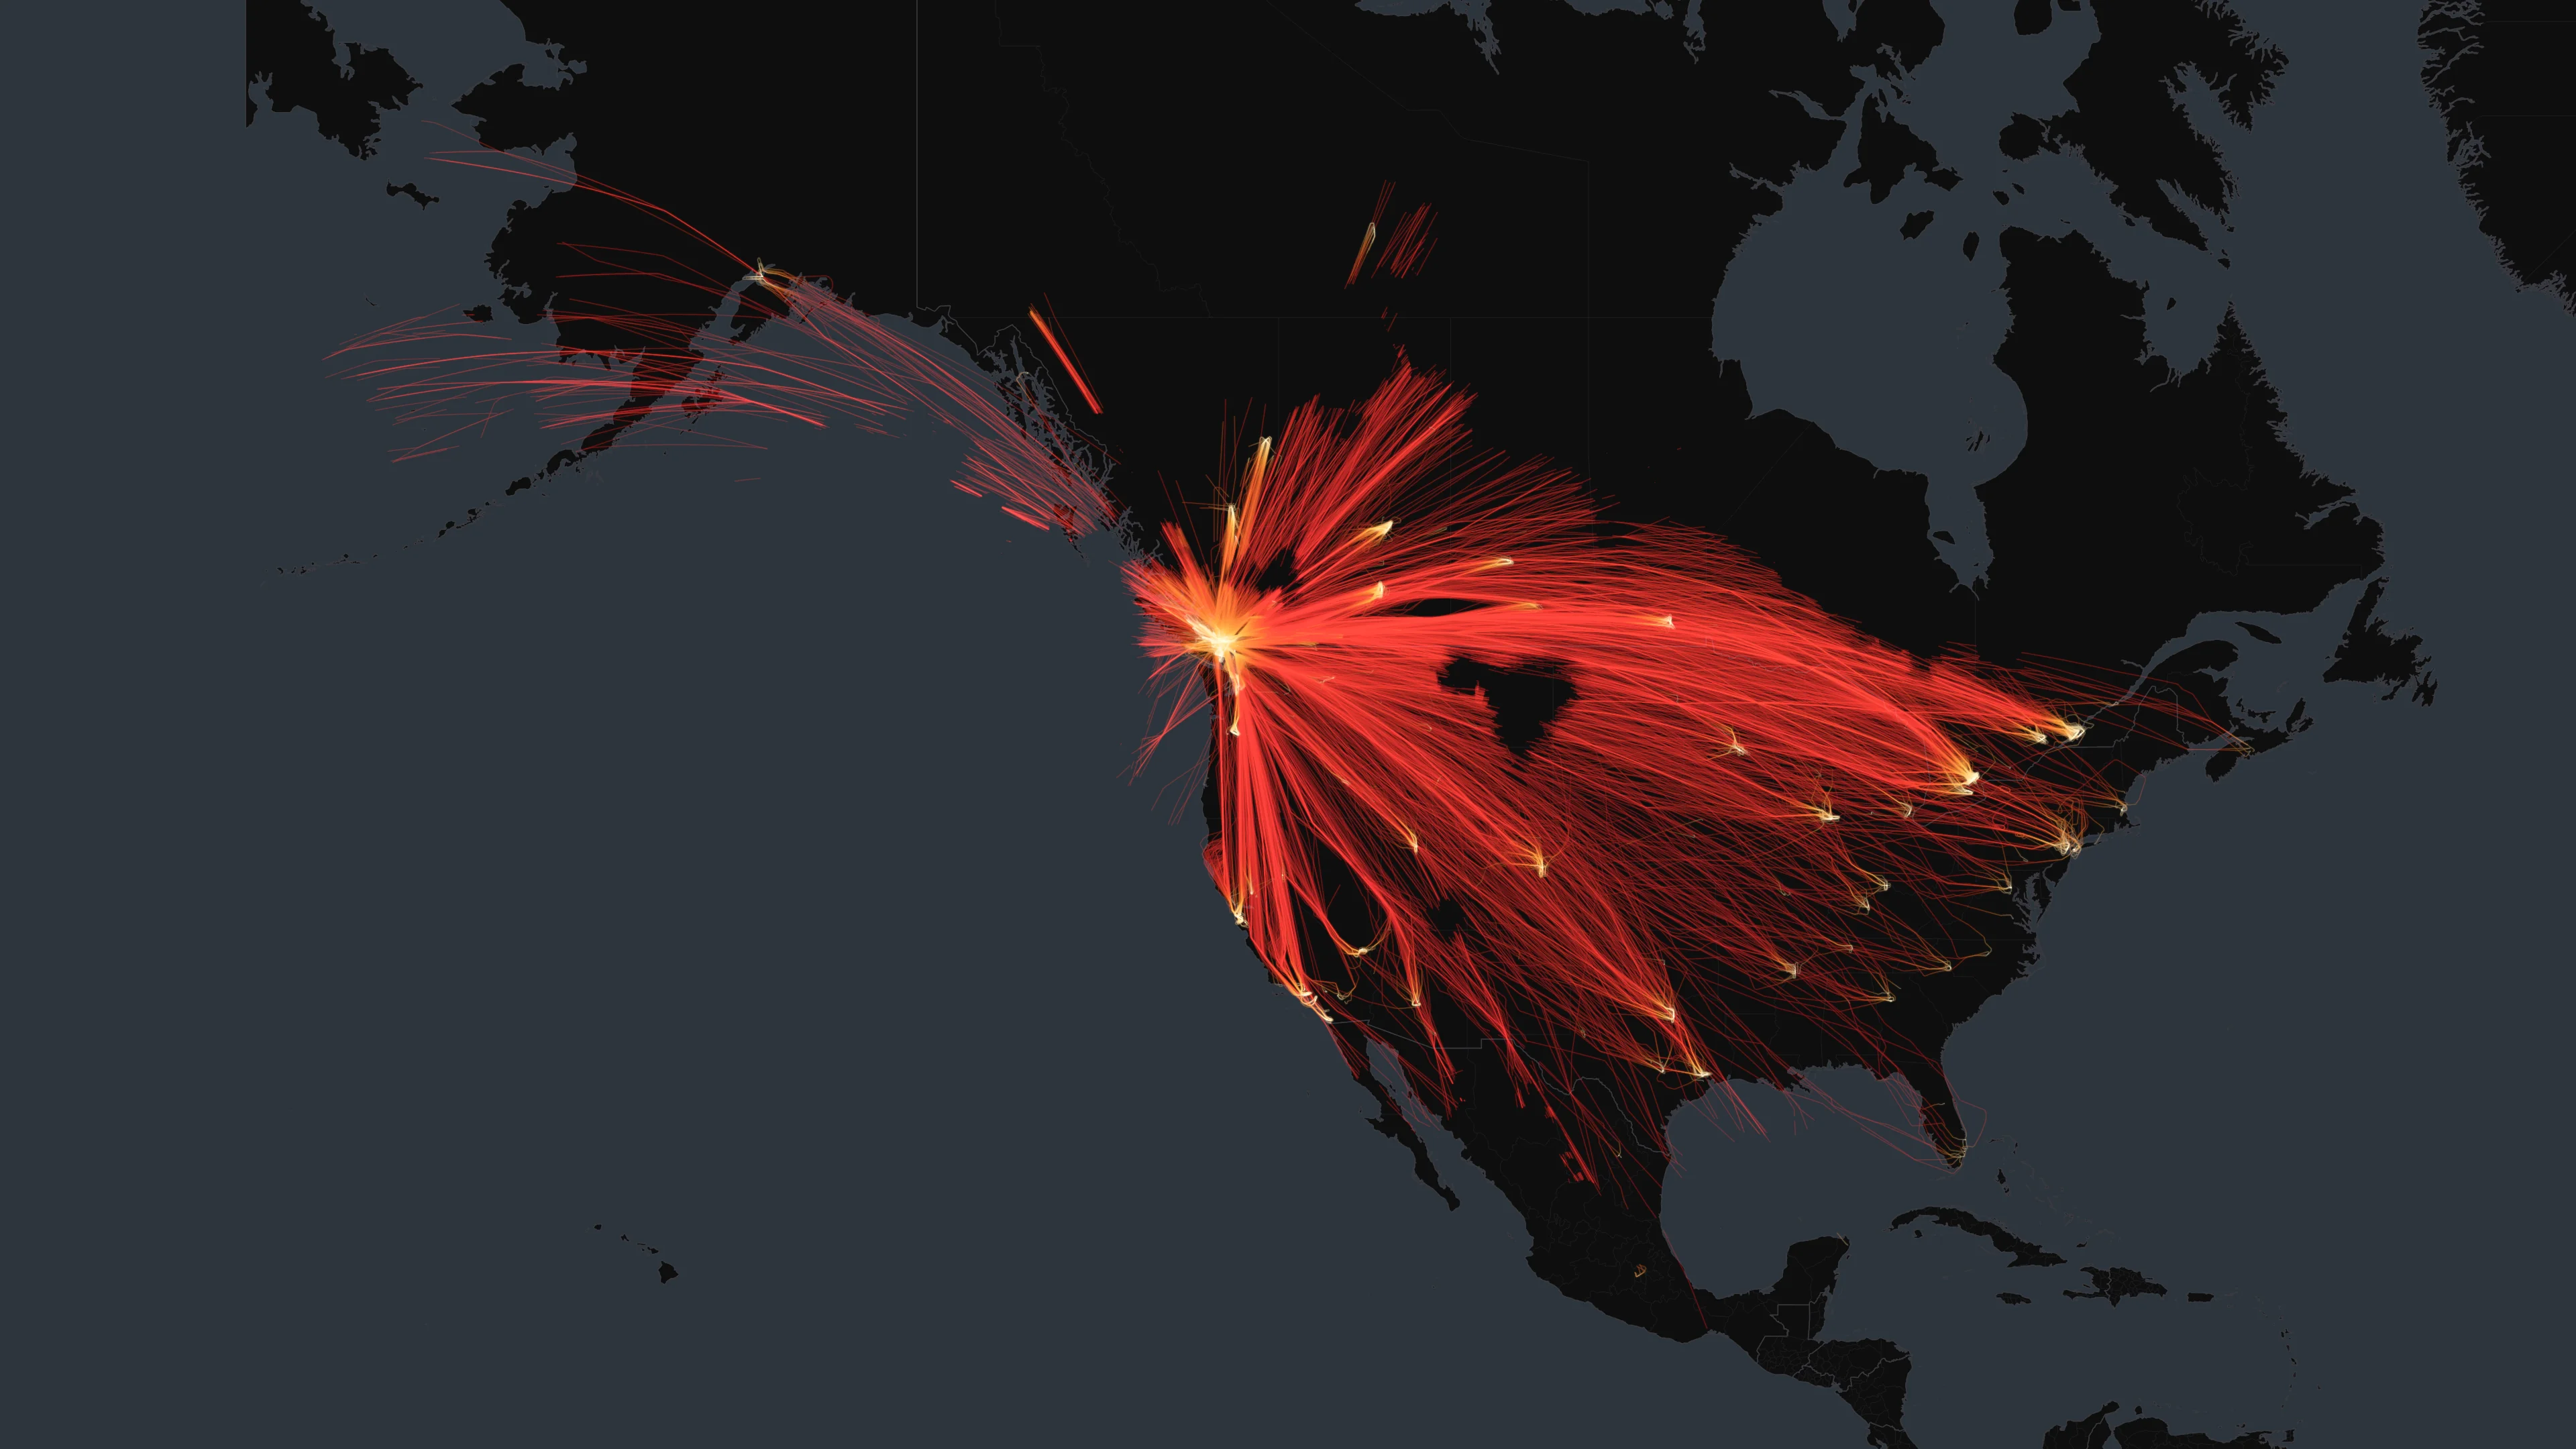
Routes
Arriving from
YYC
Calgary International Airport563
YYZ
Toronto Pearson International Airport366
YEG
Edmonton International Airport288
YYJ
Victoria International Airport259
SEA
Seattle–Tacoma International Airport257
SFO
San Francisco International Airport154
LAX
Los Angeles International Airport131
YWG
Winnipeg / James Armstrong Richardson International Airport115
YXS
Prince George (Intl) Airport104
YUL
Montreal / Pierre Elliott Trudeau International Airport94
DEN
Denver International Airport85
YQQ
Comox Valley International Airport / CFB Comox81
PDX
Portland International Airport81
YXE
Saskatoon John G. Diefenbaker International Airport72
ORD
Chicago O'Hare International Airport70
YXJ
Fort St John / North Peace Regional Airport65
YOW
Ottawa Macdonald-Cartier International Airport55
SLC
Salt Lake City International Airport49
SAN
San Diego International Airport48
LAS
Harry Reid International Airport47
Departing to
YYC
Calgary International Airport601
YYZ
Toronto Pearson International Airport415
YEG
Edmonton International Airport307
SEA
Seattle–Tacoma International Airport283
SFO
San Francisco International Airport150
LAX
Los Angeles International Airport140
YXS
Prince George (Intl) Airport122
YUL
Montreal / Pierre Elliott Trudeau International Airport106
YWG
Winnipeg / James Armstrong Richardson International Airport104
DEN
Denver International Airport95
YQQ
Comox Valley International Airport / CFB Comox89
PDX
Portland International Airport79
YXJ
Fort St John / North Peace Regional Airport73
YXE
Saskatoon John G. Diefenbaker International Airport72
SLC
Salt Lake City International Airport55
DFW
Dallas Fort Worth International Airport51
YYJ
Victoria International Airport49
IAH
George Bush Intercontinental Airport49
YHM
John C. Munro Hamilton International Airport49
SAN
San Diego International Airport48
Aircraft by Registration Country
United States698
Canada630
China49
United Kingdom32
Japan30
Germany27
South Korea18
Taiwan16
Mexico16
France13
Aircraft
1602 unique aircraft
C-GGND
101 flights
C-GJZG
95 flights
C-GJZX
93 flights
C-GIJZ
89 flights
C-GGNZ
88 flights
C-GBJZ
84 flights
C-GJZR
78 flights
C-GGMI
77 flights
C-GJZF
76 flights
C-FLDX
75 flights
C-GGMU
74 flights
C-GGNY
73 flights
C-GEHI
71 flights
C-GGNW
71 flights
C-FLKO
70 flights
C-FANF
69 flights
C-GWEJ
68 flights
C-FFEL
64 flights
C-FSJH
61 flights
C-FUJZ
60 flights
The shape above is YVR's portrait, on museum-quality aluminum.